
Mathematics, 13.05.2021 07:40 chychy2003
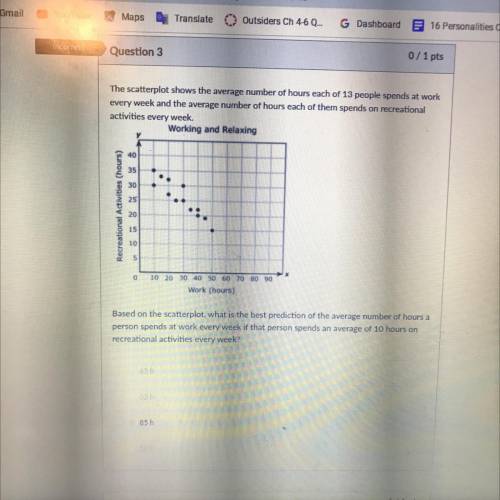
The scatterplot shows the average number of hours each of 13 people spends at work
every week and the average number of hours each of them spends on recreational
activities every week.
Working and Relaxing
40
30
Recreational Activities (hours)
20
15
10
0 10 20 30 40 50 60 70 80 90
Work (hours)
Based on the scatterplot, what is the best prediction of the average number of hours a
person spends at work every week if that person spends an average of 10 hours on
recreational activities every week?

Answers: 3


Another question on Mathematics
Mathematics, 21.06.2019 22:30
Which of the functions below could have created this graph?
Answers: 1
Mathematics, 21.06.2019 22:50
Type the correct answer in the box. use numerals instead of words. if necessary, use / for the fraction bar.
Answers: 1
Mathematics, 21.06.2019 23:10
Tom travels between the two mile markers shown and then finds his average speed in miles per hour. select the three equations that represent this situation.
Answers: 1
You know the right answer?
The scatterplot shows the average number of hours each of 13 people spends at work
every week and t...
Questions


English, 25.08.2019 09:10


Geography, 25.08.2019 09:10
History, 25.08.2019 09:10
History, 25.08.2019 09:10
Health, 25.08.2019 09:10
Mathematics, 25.08.2019 09:10
History, 25.08.2019 09:10

Biology, 25.08.2019 09:10


Advanced Placement (AP), 25.08.2019 09:10


