Question 10 of 10
If a sample mean is 37, which of the following is most likely the range of
...

Mathematics, 13.05.2021 14:00 130005401
Question 10 of 10
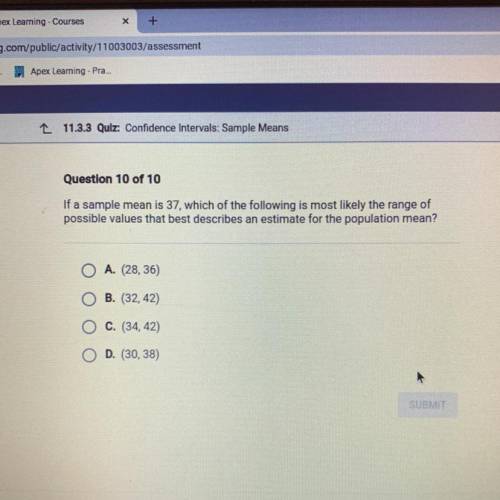
If a sample mean is 37, which of the following is most likely the range of
possible values that best describes an estimate for the population mean?
O A. (28,36)
B. (32, 42)
C. (34, 42)
D. (30,38)

Answers: 2


Another question on Mathematics
Mathematics, 21.06.2019 20:00
True or false: the graph of y=f(bx) is a horizontal compression of the graph y=f(x) if b< 1
Answers: 2
Mathematics, 21.06.2019 22:10
Using graph paper, determine the line described by the given point and slope. click to show the correct graph below.(0, 0) and 2/3
Answers: 2
You know the right answer?
Questions

English, 06.03.2021 01:20

Physics, 06.03.2021 01:20

Chemistry, 06.03.2021 01:20
Mathematics, 06.03.2021 01:20

French, 06.03.2021 01:20
English, 06.03.2021 01:20
Physics, 06.03.2021 01:20


Business, 06.03.2021 01:20

Mathematics, 06.03.2021 01:20
Mathematics, 06.03.2021 01:20


