This dot plot is symmetric, and the data set has no
extreme values.
4 5 6 7 8 9 10
What...

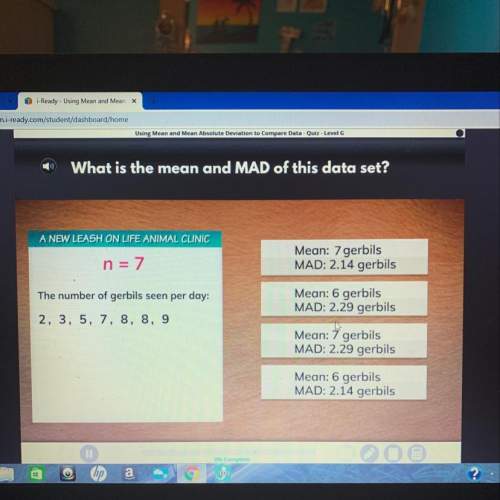
Mathematics, 13.05.2021 21:10 bermudezsamanth
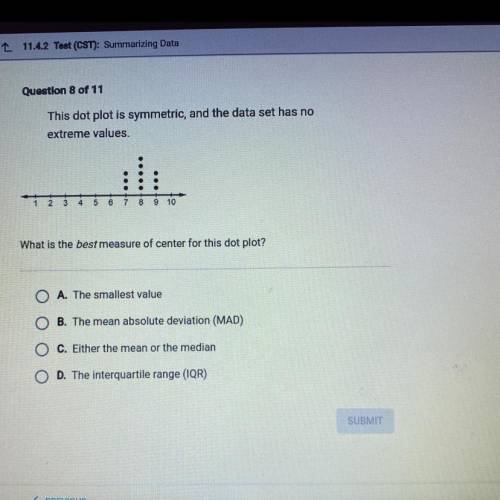
This dot plot is symmetric, and the data set has no
extreme values.
4 5 6 7 8 9 10
What is the best measure of center for this dot plot?
O A. The smallest value
OB. The mean absolute deviation (MAD)
O C. Either the mean or the median
O D. The interquartile range (IQR)

Answers: 2


Another question on Mathematics
Mathematics, 21.06.2019 22:00
Given: △acm, m∠c=90°, cp ⊥ am , ac: cm=3: 4, mp-ap=1. find am.
Answers: 2
Mathematics, 21.06.2019 22:30
What is the name of a polygon that has four congruent sides and theses angle measures 60,120,60,120?
Answers: 1
Mathematics, 21.06.2019 22:30
Explain how you could use the interactive table to tell if sets of points are on the same line. math 8
Answers: 2
Mathematics, 21.06.2019 23:00
Perry observes the opposite parallel walls of a room in how many lines do the plains containing the walls intersect
Answers: 1
You know the right answer?
Questions
Mathematics, 21.11.2020 07:00

Physics, 21.11.2020 07:00

History, 21.11.2020 07:00
Mathematics, 21.11.2020 07:00

English, 21.11.2020 07:00
English, 21.11.2020 07:00


History, 21.11.2020 07:10

Advanced Placement (AP), 21.11.2020 07:10


