HURRY PLEASE
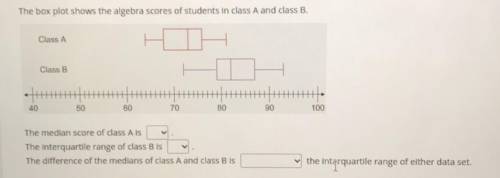
The box plot shows the algebra scores of students in class A and class B.
...

Mathematics, 13.05.2021 21:40 kritalewis
HURRY PLEASE
The box plot shows the algebra scores of students in class A and class B.
The median score of class A is ___
The interquartile range of class B is ___
The difference of the medians of class A and class B is ___
the Interquartile range of either data set.


Answers: 3


Another question on Mathematics

Mathematics, 21.06.2019 15:30
Match each equation with the operation you can use to solve for the variable. 1 subtract 10 2 divide by 10 3add 18 4add 10 5 subtact 18 6multiply by 5. 7multiply by 10. a 5 = 10p b p + 10 = 18 c p + 18 = 5 d 5p = 10
Answers: 3

Mathematics, 21.06.2019 16:00
Asegment in the complex plane has a midpoint at 7 – 2i. if the segment has an endpoint at 11 – 3i, what is the other endpoint?
Answers: 1

Mathematics, 21.06.2019 16:40
Tcan be concluded that % of the seniors would prefer to see more candid pictures in this year's edition of the yearbook.
Answers: 1

Mathematics, 21.06.2019 20:30
What is 1/3x5 on anuber line what does it look like on a number line
Answers: 3
You know the right answer?
Questions


History, 22.01.2021 16:00

Mathematics, 22.01.2021 16:00

Biology, 22.01.2021 16:00

English, 22.01.2021 16:00


English, 22.01.2021 16:00

English, 22.01.2021 16:10


Mathematics, 22.01.2021 16:10


Social Studies, 22.01.2021 16:10

Biology, 22.01.2021 16:10


