
Mathematics, 13.05.2021 23:10 karenpazyuli
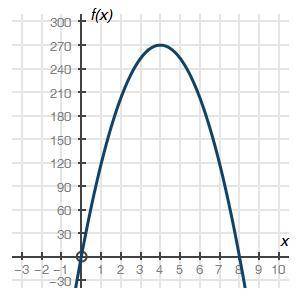
The graph below shows a company's profit f(x), in dollars, depending on the price of erasers x, in dollars, sold by the company:
Graph of quadratic function f of x having x intercepts at ordered pairs 0, 0 and 8, 0. The vertex is at 4, 270.
Part A: What do the x-intercepts and maximum value of the graph represent? What are the intervals where the function is increasing and decreasing, and what do they represent about the sale and profit? (4 points)
Part B: What is an approximate average rate of change of the graph from x = 1 to x = 4, and what does this rate represent? (3 points)
Part C: Describe the constraints of the domain. (3 points)

Answers: 2


Another question on Mathematics
Mathematics, 21.06.2019 23:30
Petes dog weighed 30 pounds it then lost 16% of it's weight how much did pete lose
Answers: 2
Mathematics, 22.06.2019 00:40
If a distance of 75 yds is measured back from the edge of the canyon and two angles are measured , find the distance across the canyon angle acb = 50° angle abc=100° a=75 yds what does c equal?
Answers: 1
Mathematics, 22.06.2019 01:30
What is the surface area of a cube with the volume of 729 ft?
Answers: 1
You know the right answer?
The graph below shows a company's profit f(x), in dollars, depending on the price of erasers x, in d...
Questions
Mathematics, 26.01.2021 05:00

Health, 26.01.2021 05:00


History, 26.01.2021 05:00
Mathematics, 26.01.2021 05:00
Mathematics, 26.01.2021 05:00
Mathematics, 26.01.2021 05:00

Geography, 26.01.2021 05:00
Mathematics, 26.01.2021 05:00
Mathematics, 26.01.2021 05:00
Mathematics, 26.01.2021 05:00
Mathematics, 26.01.2021 05:00


