
Mathematics, 14.05.2021 01:30 cricri2347
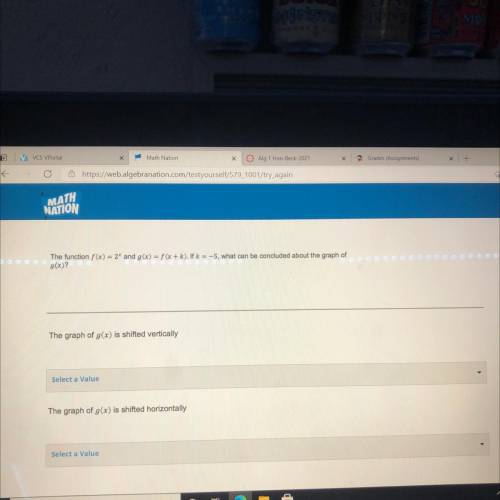
The function f(x) = 2* and g(x) = f (x + k). If k = -5, what can be concluded about the graph of
g(x)?
EUR
The graph of g(x) is shifted vertically
Select a Value
The graph of g(x) is shifted horizontally
Select a Value

Answers: 1


Another question on Mathematics
Mathematics, 21.06.2019 13:20
Sherina wrote and solved the equation. x-56=230 x-56-56=230-56 x=174 what was sherina’s error? sherina’s work is correct. sherina only needed to subtract 56 from 230. sherina made a subtraction error when subtracting 56 from 230. sherina should have added 56 to both sides of the equation.
Answers: 2
Mathematics, 21.06.2019 16:00
If myesha works overtime, she gets paid "time and a half" for every hour she works. in other words, for every hour over 40 hours myesha works each week, she gets her hourly pay plus half her hourly pay. what is myesha's pay per hour when she works overtime?
Answers: 1
Mathematics, 21.06.2019 16:00
Part one: measurements 1. measure your own height and arm span (from finger-tip to finger-tip) in inches. you will likely need some from a parent, guardian, or sibling to get accurate measurements. record your measurements on the "data record" document. use the "data record" to you complete part two of this project. name relationship to student x height in inches y arm span in inches archie dad 72 72 ginelle mom 65 66 sarah sister 64 65 meleah sister 66 3/4 67 rachel sister 53 1/2 53 emily auntie 66 1/2 66 hannah myself 66 1/2 69 part two: representation of data with plots 1. using graphing software of your choice, create a scatter plot of your data. predict the line of best fit, and sketch it on your graph. part three: the line of best fit include your scatter plot and the answers to the following questions in your word processing document 1. 1. which variable did you plot on the x-axis, and which variable did you plot on the y-axis? explain why you assigned the variables in that way. 2. write the equation of the line of best fit using the slope-intercept formula $y = mx + b$. show all your work, including the points used to determine the slope and how the equation was determined. 3. what does the slope of the line represent within the context of your graph? what does the y-intercept represent? 5. use the line of best fit to you to describe the data correlation.
Answers: 2
Mathematics, 21.06.2019 20:20
Recall that the owner of a local health food store recently started a new ad campaign to attract more business and wants to know if average daily sales have increased. historically average daily sales were approximately $2,700. the upper bound of the 95% range of likely sample means for this one-sided test is approximately $2,843.44. if the owner took a random sample of forty-five days and found that daily average sales were now $2,984, what can she conclude at the 95% confidence level?
Answers: 1
You know the right answer?
The function f(x) = 2* and g(x) = f (x + k). If k = -5, what can be concluded about the graph of
g(...
Questions

Mathematics, 27.02.2020 06:24

History, 27.02.2020 06:24

Health, 27.02.2020 06:24

Mathematics, 27.02.2020 06:25
Mathematics, 27.02.2020 06:25
Mathematics, 27.02.2020 06:25
Mathematics, 27.02.2020 06:25
History, 27.02.2020 06:25
Biology, 27.02.2020 06:25


