
Mathematics, 14.05.2021 18:30 Alayna1037
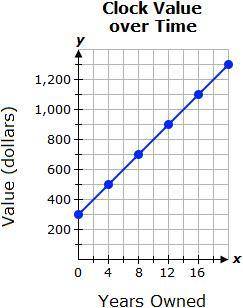
Several years ago, Mr. Davis bought an antique clock. Since then, it has increased in value. In this graph, x represents the number of years he has owned the clock, and y represents the value of the clock in dollars. Which situation is represented by the graph below?
IS D TRUE???
A.
Mr. Davis bought a clock worth $300. Each year the value of the clock has increased by $100.
B.
Mr. Davis bought a clock worth $300. Each year the value of the clock has increased by $50.
C.
Mr. Davis bought a clock worth $300. Each year the value of the clock has increased by $200.
D.
Mr. Davis bought a clock worth $300. Each year the value of the clock has increased by $125.

Answers: 2


Another question on Mathematics
Mathematics, 21.06.2019 13:10
(a) solve h+2/6 = h-3/4(b) solve the following simultaneous equations. 2x = y + 66x - 2y = 13x = ? y = ?
Answers: 1
Mathematics, 21.06.2019 15:00
(urgent ) use pi 3.14 to estimate the circumference of the circle to the nearest hundredth middle is 4in (urgent )
Answers: 1
Mathematics, 21.06.2019 17:00
You have $600,000 saved for retirement. your account earns 5.5% interest. how much, to the nearest dollar, will you be able to pull out each month, if you want to be able to take withdrawals for 20 years?
Answers: 1
You know the right answer?
Several years ago, Mr. Davis bought an antique clock. Since then, it has increased in value. In this...
Questions
Mathematics, 20.01.2020 06:31

Social Studies, 20.01.2020 06:31


History, 20.01.2020 06:31
Mathematics, 20.01.2020 06:31
Mathematics, 20.01.2020 06:31
Mathematics, 20.01.2020 06:31

Physics, 20.01.2020 06:31
Mathematics, 20.01.2020 06:31

Health, 20.01.2020 06:31

Business, 20.01.2020 06:31
Business, 20.01.2020 06:31


