
Mathematics, 14.05.2021 21:20 liddopiink1
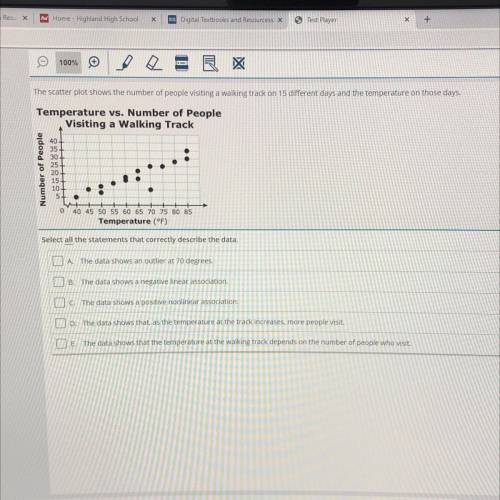
The scatter plot shows the number of people visiting a walking track on 15 different days and the temperature on those days.
Temperature vs. Number of People
Visiting a Walking Track
40
35
30
25
20
15
10+
5+
0
40 45 50 55 60 65 70 75 80 85
Temperature (°F)
Select all the statements that correctly describe the data.
A. The data shows an outlier at 70 degrees.
B. The data shows a negative linear association.
C. The data shows a positive nonlinear association.
D. The data shows that, as the temperature at the track increases, more people visit.
E. The data shows that the temperature at the walking track depends on the number of people who visit.

Answers: 1


Another question on Mathematics
Mathematics, 21.06.2019 13:30
Combined megan and kelly worked 60 hours.kelly worked twice as many hours as megan.how many hours did they each worked?
Answers: 3
Mathematics, 21.06.2019 15:20
At the newest animated movie, for every 9 children, there are 4 adults. there are a total of 39 children and adults at the movie.
Answers: 2
Mathematics, 21.06.2019 20:00
Rectangle bcde is similar to rectangle vwxy. what is the length of side vy? a) 1 7 b) 2 7 c) 3 7 d) 4 7
Answers: 3
You know the right answer?
The scatter plot shows the number of people visiting a walking track on 15 different days and the te...
Questions


Biology, 21.02.2020 01:31


Biology, 21.02.2020 01:31
Mathematics, 21.02.2020 01:32

History, 21.02.2020 01:32
Biology, 21.02.2020 01:32


