
Mathematics, 17.05.2021 04:00 sweetgirl22899
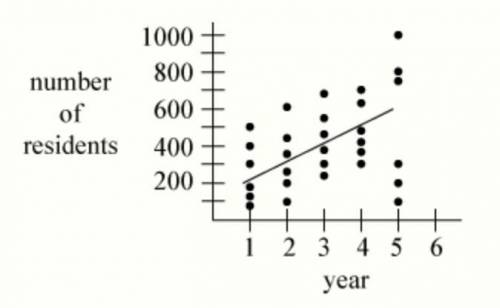
The scatterplot below shows the average population of several cities in a state over five years. Based on the model, how many more residents, on average, will be living in the cities in the sixth year than were living in the cities in the first year?
Select one or more:
A. 200
B. 300
C. 400
D. 500

Answers: 1


Another question on Mathematics
Mathematics, 21.06.2019 14:30
Compare these two waves: the blue and orange waves have the same pitch, but the blue wave is louder. the blue and orange waves have the same volume, but the blue wave has a higher pitch. the orange wave has a higher pitch, but the blue wave is louder. the blue wave has a higher pitch, but the orange wave is louder.
Answers: 1
Mathematics, 21.06.2019 18:00
Need on this geometry question. explain how you did it.
Answers: 2
Mathematics, 21.06.2019 21:00
Oliver read for 450 minutes this month his goal was to read for 10% more minutes next month if all of her medicine go how many minutes will you read all during the next two months
Answers: 3
You know the right answer?
The scatterplot below shows the average population of several cities in a state over five years. Bas...
Questions
Mathematics, 10.10.2019 08:10

Geography, 10.10.2019 08:10


Mathematics, 10.10.2019 08:10
Mathematics, 10.10.2019 08:10
Mathematics, 10.10.2019 08:10
Mathematics, 10.10.2019 08:10
History, 10.10.2019 08:10

Biology, 10.10.2019 08:10
Mathematics, 10.10.2019 08:10
Mathematics, 10.10.2019 08:10
Mathematics, 10.10.2019 08:10

Arts, 10.10.2019 08:10


