
Mathematics, 18.05.2021 06:50 ChefCurtis
Please help me imma cry
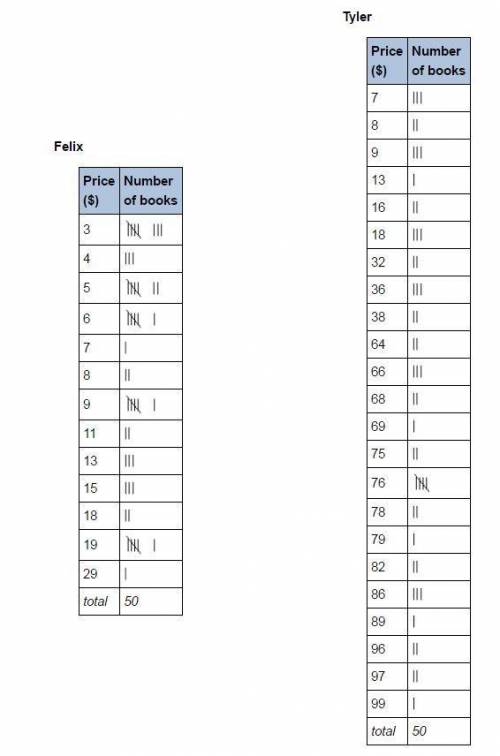
Draw a histogram and a box-and-whisker plot to represent the combined data, and answer the questions. Be sure to include the new graphs as part of your final submission.
I can answer the questions on my own I just need the graphs I don't know how to do it please help.

Answers: 1


Another question on Mathematics
Mathematics, 21.06.2019 12:30
Adriano loves anime and collects toys from his favorite series.each month he gains 4 toys. if adriano has 3 toys when he starts collecting, how many does he have after 4 months
Answers: 2
Mathematics, 21.06.2019 17:40
Aperpendicular bisector, cd is drawn through point con ab if the coordinates of point a are (-3, 2) and the coordinates of point b are (7,6), the x-intercept of cd is point lies on cd.
Answers: 2
Mathematics, 21.06.2019 23:40
You are saving to buy a bicycle; so far you save 55.00. the bicycle costs 199.00. you earn 9.00 per hour at your job. which inequality represents the possible number of h hours you need to work to buy the bicycle?
Answers: 2
You know the right answer?
Please help me imma cry
Draw a histogram and a box-and-whisker plot to represent the combined data,...
Questions

Mathematics, 31.07.2020 04:01


Computers and Technology, 31.07.2020 04:01


Mathematics, 31.07.2020 04:01
Mathematics, 31.07.2020 04:01
Mathematics, 31.07.2020 04:01


