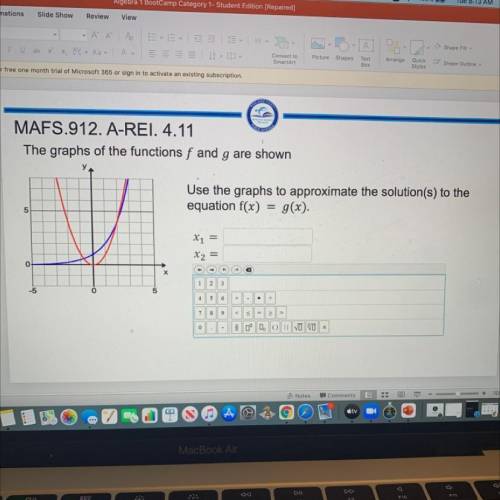
The graphs of the functions f and g are shown
У.
Use the graphs to approximate the solution(s...

Mathematics, 18.05.2021 15:30 andrewpjryan871
The graphs of the functions f and g are shown
У.
Use the graphs to approximate the solution(s) to the
equation f(x) = g(x).
X1 =
x2 =

Answers: 1


Another question on Mathematics
Mathematics, 21.06.2019 18:00
What is the measure of the smallest angle in the diagram? 15 29 32 45
Answers: 2
Mathematics, 21.06.2019 20:30
3.17 scores on stats final. below are final exam scores of 20 introductory statistics students. 1 2 3 4 5 6 7 8 9 10 11 12 13 14 15 16 17 18 19 20 57, 66, 69, 71, 72, 73, 74, 77, 78, 78, 79, 79, 81, 81, 82, 83, 83, 88, 89, 94 (a) the mean score is 77.7 points. with a standard deviation of 8.44 points. use this information to determine if the scores approximately follow the 68-95-99.7% rule. (b) do these data appear to follow a normal distribution? explain your reasoning using the graphs provided below.
Answers: 1
Mathematics, 21.06.2019 22:50
Aclassroom is made up of 11 boys and 14 girls. the teacher has four main classroom responsibilities that she wants to hand out to four different students (one for each of the four students). if the teacher chooses 4 of the students at random, then what is the probability that the four students chosen to complete the responsibilities will be all boys?
Answers: 1
You know the right answer?
Questions

Biology, 13.11.2020 01:00

Arts, 13.11.2020 01:00
Mathematics, 13.11.2020 01:00

Mathematics, 13.11.2020 01:00

Physics, 13.11.2020 01:00

Mathematics, 13.11.2020 01:00
Arts, 13.11.2020 01:00
Physics, 13.11.2020 01:00
Arts, 13.11.2020 01:00


