
Mathematics, 18.05.2021 19:30 Aianyxx
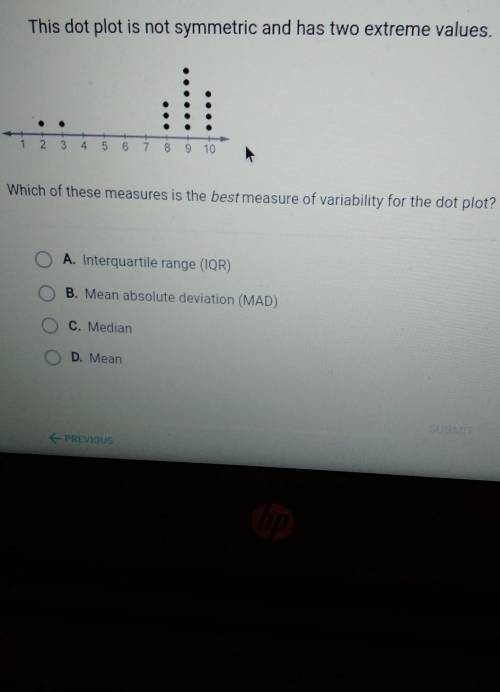
This dot plot is not symmetric and has two extreme values. 2 3 5 6 8 9 10 Which of these measures is the best measure of variability for the dot plot? O A. Interquartile range (IQR) B. Mean absolute deviation (MAD) C. Median D. Mean

Answers: 1


Another question on Mathematics
Mathematics, 21.06.2019 17:30
How is the number of vertices for a prism related to the name of the prism
Answers: 1
Mathematics, 21.06.2019 18:30
Draw a tape diagram to represent each situation.for some of the situations,you need to decide what to represent with a variable andre bakes 9 pans of brownies.he donates 7 pans to the school bake sale and keeps the rest to divide equally among his class of 30 students
Answers: 2
Mathematics, 21.06.2019 21:00
What is the length and width of a 84.5 square foot rug? will mark
Answers: 1
Mathematics, 21.06.2019 21:30
Which best describes the construction of a triangle if given the segment lengths of 2 cm, 3 cm, and 5 cm? a) unique triangle b) cannot be determined c) triangle not possible d) more than one triangle
Answers: 1
You know the right answer?
This dot plot is not symmetric and has two extreme values. 2 3 5 6 8 9 10 Which of these measures is...
Questions


Spanish, 05.07.2019 11:00

English, 05.07.2019 11:00

Advanced Placement (AP), 05.07.2019 11:00

Social Studies, 05.07.2019 11:00
English, 05.07.2019 11:00
Mathematics, 05.07.2019 11:00


World Languages, 05.07.2019 11:00

Biology, 05.07.2019 11:00

History, 05.07.2019 11:00

Health, 05.07.2019 11:00


