
Mathematics, 18.05.2021 23:10 17jhester1
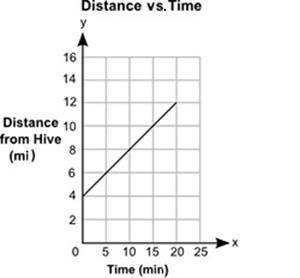
The graph below shows the distance, y, in miles, of a bee from its hive, for a certain amount of time, x, in minutes:
Based on the graph, what is the initial value of the graph and what does it represent?
0.4 mile per minute; it represents the speed of the bee
0.4 mile; it represents the original distance of the bee from its hive
4 miles; it represents the original distance of the bee from its hive
4 miles per minute; it represents the speed of the bee

Answers: 1


Another question on Mathematics
Mathematics, 21.06.2019 14:00
In factoring by grouping, what would you have for step 3 for the following? step 1: x^3 +5x^2 +4x+20 step 2: x^2 (x+5)+4(x+5) step 3: ?
Answers: 2
Mathematics, 21.06.2019 18:00
Julius sold five times as many computers as sam sold last year. in total, they sold 78 computers. how many computers did julius sell?
Answers: 1
Mathematics, 21.06.2019 18:00
Factor x2 – 8x + 15. which pair of numbers has a product of ac and a sum of what is the factored form of the
Answers: 1
You know the right answer?
The graph below shows the distance, y, in miles, of a bee from its hive, for a certain amount of tim...
Questions


Mathematics, 29.01.2020 16:00
Mathematics, 29.01.2020 16:00
Mathematics, 29.01.2020 16:00

Mathematics, 29.01.2020 16:01
English, 29.01.2020 16:01

Social Studies, 29.01.2020 16:01
Social Studies, 29.01.2020 16:01
Mathematics, 29.01.2020 16:01
English, 29.01.2020 16:01


