
Mathematics, 19.05.2021 02:20 Kira4585
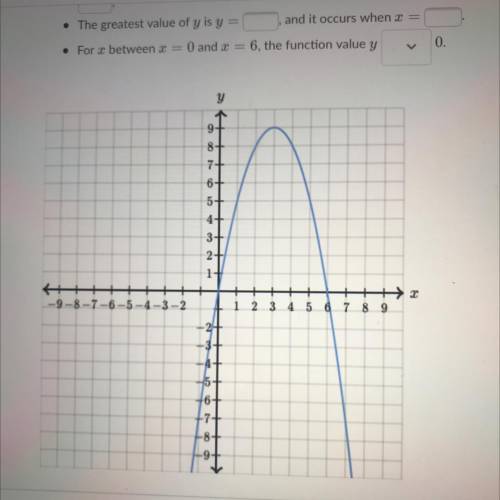
The illustration below shows the graph of y as a function of 2.
Complete the following sentences based on the graph of the function.
(Enter the s-intercepts from least to greatest.)
• This is the graph of a
V
function.
• The y-intercept of the graph is the function value y =
• The -intercepts of the graph (in order from least to greatest) are located at 2 =
and 2 =
and it occurs when =
• The greatest value of y is y =
0.
V
• For s between 2 = 0 and 3 = 6, the function value y

Answers: 1


Another question on Mathematics
Mathematics, 21.06.2019 22:30
Kevin's bank offered him a 4.5% interest rate for his mortgage. if he purchases 3 points, what will be his new rate?
Answers: 2
Mathematics, 22.06.2019 02:10
The key on a road map has a scale factor of 1.5 inches = 50 miles. the distance between santa fe and albuquerque measures 7.5 inches. the distance between santa fe and taos is 0.75 inches. what is the actual distance between the cities?
Answers: 3
You know the right answer?
The illustration below shows the graph of y as a function of 2.
Complete the following sentences ba...
Questions
Mathematics, 19.04.2021 09:10
Mathematics, 19.04.2021 09:10

Mathematics, 19.04.2021 09:20

English, 19.04.2021 09:20

History, 19.04.2021 09:20
Mathematics, 19.04.2021 09:20

Biology, 19.04.2021 09:20
Mathematics, 19.04.2021 09:20
English, 19.04.2021 09:20
Mathematics, 19.04.2021 09:20
History, 19.04.2021 09:20
English, 19.04.2021 09:20
Mathematics, 19.04.2021 09:20
History, 19.04.2021 09:20

Geography, 19.04.2021 09:20


