11. Analyze the graph below. What equation represents the graph? 8.51
y
-21
-6
9<...

Mathematics, 20.05.2021 04:20 juliopejfuhrf7336
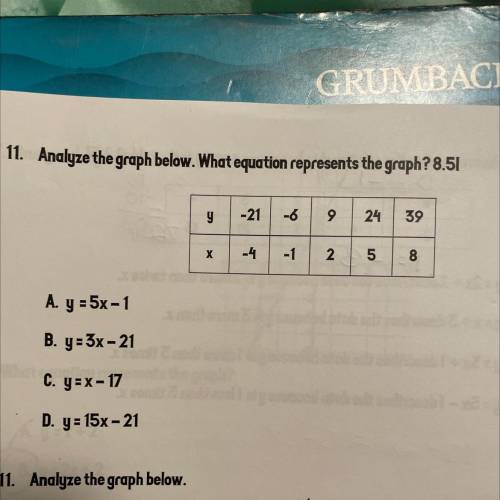
11. Analyze the graph below. What equation represents the graph? 8.51
y
-21
-6
9
24
39
х
2
5
8
A. y = 5x-1
B. y = 3x - 21
C. y=x-17
D. y = 15x -21

Answers: 3


Another question on Mathematics
Mathematics, 21.06.2019 20:00
Which of these numbers of simulations of an event would be most likely to produce results that are closest to those predicted by probability theory? 15, 20, 5, 10
Answers: 2
Mathematics, 21.06.2019 21:00
Hurry if the population of of an ant hill doubles every 10 days and there are currently 100 ants living in the ant hill what will the ant population be in 20 days
Answers: 2
Mathematics, 21.06.2019 23:20
Find the value of x in the diagram below. select the best answer from the choices provided
Answers: 1
Mathematics, 22.06.2019 01:00
If log_3(x)=4.5 and log_3(y)=3, what is log_3(x^2/y)? a. 3b. 6.75c. 6d. 1.5
Answers: 2
You know the right answer?
Questions


Geography, 24.06.2020 16:01

Chemistry, 24.06.2020 16:01
Mathematics, 24.06.2020 16:01

Mathematics, 24.06.2020 16:01
Chemistry, 24.06.2020 16:01

Mathematics, 24.06.2020 16:01
Mathematics, 24.06.2020 16:01
Mathematics, 24.06.2020 16:01
Mathematics, 24.06.2020 16:01

Mathematics, 24.06.2020 16:01


