
Mathematics, 20.05.2021 18:20 cinthyafleitas
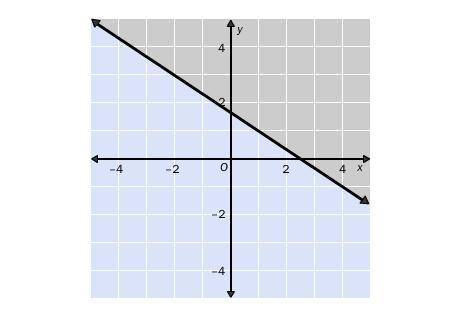
10.
Choose the linear inequality that describes the graph. The gray area represents the shaded region.
A. 4x + 6y ≥ –10
B. 4x + 6y ≥ 10
C. 4x – 6y ≥ 10
D. 4x + 6y ≤ 10

Answers: 1


Another question on Mathematics
Mathematics, 21.06.2019 22:30
Which set of lengths could represent the sides of a triangle? a. 3, 7, 10 b. 4, 5, 10 c. 6, 8, 14 d. 12, 6, 7
Answers: 1
Mathematics, 22.06.2019 02:30
Will’s boss has asked him to compile the credit scores of everyone in his department. the data that will collected is shown in the table below. what is the mode of the credit scores in will’s department? (round to the nearest whole point, if applicable.) 634 667 644 892 627 821 857 703 654 a. 667 b. 722 c. 627 d. there is no mode in this group.
Answers: 1
Mathematics, 22.06.2019 03:20
Through which points should a line of rotation be placed to create a cylinder with a radius of 3 units
Answers: 2
You know the right answer?
10.
Choose the linear inequality that describes the graph. The gray area represents the shaded regi...
Questions
Mathematics, 14.05.2021 19:20


Mathematics, 14.05.2021 19:30


English, 14.05.2021 19:30


Health, 14.05.2021 19:30
Mathematics, 14.05.2021 19:30
Chemistry, 14.05.2021 19:30
Mathematics, 14.05.2021 19:30


