
Mathematics, 21.05.2021 07:00 msjsnell29
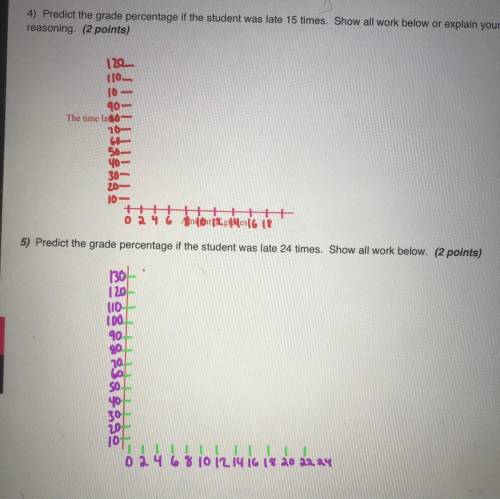
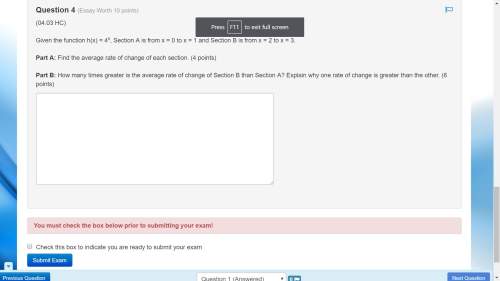
Goal: To use the line of best fit to make predictions
The chart below shows the number of times a student was late for Math Class as well as student's grade
in the class. Plot the points on the coordinate plan and answer questions a- e.
Number of
Late Arrivals
12
4
0
10
15
18
00
1
3
00
0
7
10
2
11
Grade (%)
65
75
78
45
58
54
68
85
90
63
82
72
62
76
71
Hi

Answers: 2


Another question on Mathematics
Mathematics, 21.06.2019 18:30
Given: m∠ adb = m∠cdb ad ≅ dc prove: m∠ bac = m∠bca lol
Answers: 2
Mathematics, 21.06.2019 19:50
Organic apples are on special for $1.50 per pound. does total cost vary inversely or directly with the number of pounds purchased? find the cost of 3.4 pounds of apples. a. inversely: $5.10 b. directly; $5.10 c. inversely: $2.27 d. directly; $2.27
Answers: 1
Mathematics, 21.06.2019 23:00
Astore sells 4 apples for $3 and 3 oranges for $4 if pete buys 12 apples and 12 oranges how much will it cost
Answers: 1
Mathematics, 22.06.2019 01:00
Find the average rate of change for the given function drom x=1 to x=2
Answers: 1
You know the right answer?
Goal: To use the line of best fit to make predictions
The chart below shows the number of times a s...
Questions


Biology, 20.04.2021 00:44
Mathematics, 20.04.2021 00:44

Mathematics, 20.04.2021 00:44

Geography, 20.04.2021 00:44
Mathematics, 20.04.2021 00:44

Mathematics, 20.04.2021 00:44

Mathematics, 20.04.2021 00:44


