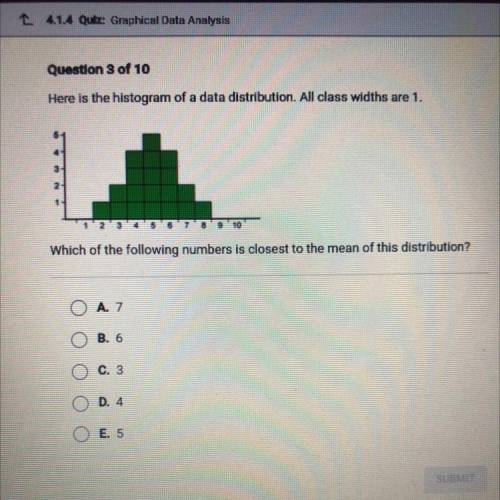
Here is the histogram of a data distribution. All class widths are 1.
4
5
9 10
Wh...

Mathematics, 21.05.2021 09:30 Aminton737
Here is the histogram of a data distribution. All class widths are 1.
4
5
9 10
Which of the following numbers is closest to the mean of this distribution?
O A7
B. 6

Answers: 3


Another question on Mathematics
Mathematics, 21.06.2019 17:00
Can someone pls ! pls answer all. no explanation needed..
Answers: 1
Mathematics, 21.06.2019 19:00
Me asap on # : explain how factoring a trinomial, ax^2+ bx+ c, when a does not equal 1 different from factoring a trinomial when a = 1.
Answers: 2
Mathematics, 22.06.2019 00:30
Tim tradesman pays $2,000 annually for $125,000 worth of life insurance. what is the cash value of the policy after 10 years? 11,125 13,125 17,800 111,250
Answers: 2
You know the right answer?
Questions


Mathematics, 31.03.2020 03:50

Business, 31.03.2020 03:50

English, 31.03.2020 03:50


