
Mathematics, 21.05.2021 19:50 azibur3191
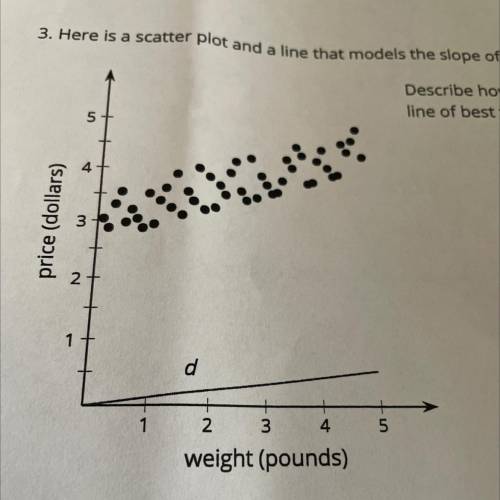
3. Here is a scatter plot and a line that models the slope of the data.
Describe how to move line d to make it a
line of best fit for the scatter plot.
5
price (dollars)
2
1
d
5
1
2
4
3
weight (pounds)

Answers: 2


Another question on Mathematics
Mathematics, 21.06.2019 19:50
Which inequality is equivalent to -3x < -12? x < 4 , x < -4 , x > 4, x > -4
Answers: 1
Mathematics, 21.06.2019 22:00
The evening newspaper is delivered at a random time between 5: 30 and 6: 30 pm. dinner is at a random time between 6: 00 and 7: 00 pm. each spinner is spun 30 times and the newspaper arrived 19 times before dinner. determine the experimental probability of the newspaper arriving before dinner.
Answers: 1
Mathematics, 21.06.2019 22:10
Aculture started with 2,000 bacteria. after 8 hours, it grew to 2,400 bacteria. predict how many bacteria will be present after 19 hours . round your answer to the nearest whole number. p=ae^kt
Answers: 1
Mathematics, 22.06.2019 00:30
Astudent was asked to find the square of 7x+3. the student quickly wrote (7x+3)^3= 49x^2+9. identify the student's error and provide the correct answer.
Answers: 3
You know the right answer?
3. Here is a scatter plot and a line that models the slope of the data.
Describe how to move line d...
Questions
Mathematics, 09.04.2020 01:41
Mathematics, 09.04.2020 01:41


Law, 09.04.2020 01:41
Mathematics, 09.04.2020 01:41

Mathematics, 09.04.2020 01:41
English, 09.04.2020 01:42


History, 09.04.2020 01:42
English, 09.04.2020 01:42


