
Mathematics, 21.05.2021 21:30 QueenMiah16
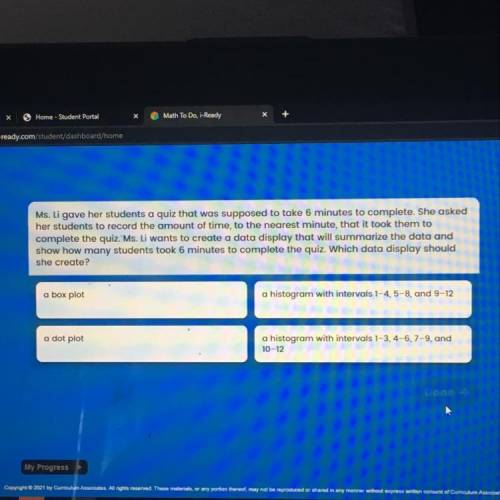
Ms. Li gave her students a quiz that was supposed to take 6 minutes to complete. She asked
her students to record the amount of time, to the nearest minute, that it took them to
complete the quiz. Ms. Li wants to create a data display that will summarize the data and
show how many students took 6 minutes to complete the quiz. Which data display should
she create?
a box plot
a histogram with intervals 1-4,5-8, and 9-12
a dot plot
a histogram with intervals 1-3, 4-6, 7-9, and
10-12
Please help!!

Answers: 3


Another question on Mathematics
Mathematics, 21.06.2019 15:00
12 point are triangles pqr and stu congruent? what is the congruency that proves they are congruent? what is the perimeter of triangle pqr?
Answers: 2
Mathematics, 21.06.2019 23:20
Question 4 of 102 pointsjuliana had $96, which is eight times as much money as al had. how mucmoney did al have? select the correct solution method below, representingals money with x.
Answers: 2
Mathematics, 22.06.2019 03:50
A11 gram sample of a substance that’s used to treat thyroid disorders has a k-value of 0.1247
Answers: 1
You know the right answer?
Ms. Li gave her students a quiz that was supposed to take 6 minutes to complete. She asked
her stud...
Questions
Mathematics, 05.01.2020 01:31

History, 05.01.2020 01:31


Biology, 05.01.2020 01:31
Mathematics, 05.01.2020 01:31
Mathematics, 05.01.2020 01:31
Mathematics, 05.01.2020 01:31

Computers and Technology, 05.01.2020 01:31

English, 05.01.2020 01:31
History, 05.01.2020 01:31
Computers and Technology, 05.01.2020 01:31
History, 05.01.2020 01:31

Business, 05.01.2020 01:31


