
Mathematics, 21.05.2021 22:30 jazzycintron14
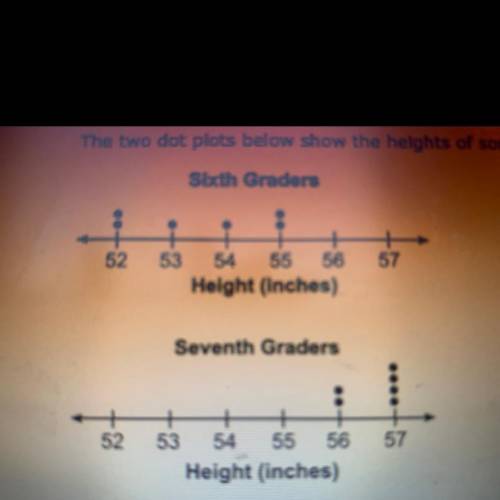
The two dot plots below show the height of some six graders and some seventh graders: The mean absolute deviation (MAD) for the first set of data is 1.2 and the MAD for the second set of data is 0.4. Approximately how many times the variability in the heights of seventh graders is the variability in the heights of the sixth graders? (round all values to the tenths place.)

Answers: 1


Another question on Mathematics
Mathematics, 21.06.2019 19:30
Which table shows a proportional relationship between miles traveled and gas used?
Answers: 2
Mathematics, 21.06.2019 22:00
Thanh and her crew are building a stage in the shape of a trapezoid for an upcoming festival. the lengths of the parallel sides of the trapezoid are 14 ft and 24 ft. the height of the trapezoid is 12 ft.what is the area of the stage? enter your answer in the box. ft²
Answers: 2
You know the right answer?
The two dot plots below show the height of some six graders and some seventh graders:
The mean abso...
Questions

Social Studies, 23.10.2019 15:00
Mathematics, 23.10.2019 15:00


English, 23.10.2019 15:00

History, 23.10.2019 15:00
Social Studies, 23.10.2019 15:00

Arts, 23.10.2019 15:00

Mathematics, 23.10.2019 15:00
Mathematics, 23.10.2019 15:00
Mathematics, 23.10.2019 15:00


