
Mathematics, 22.05.2021 01:00 zlyzoh
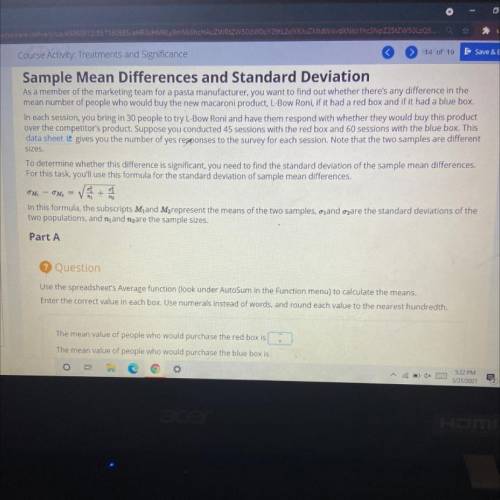
As a member of the marketing team for a pasta manufacturer, you want to find out whether there's any difference in the
mean number of people who would buy the new macaroni product, L-Bow Roni, if it had a red box and if it had a blue box.
In each session, you bring in 30 people to try L-Bow Roni and have them respond with whether they would buy this product
over the competitor's product. Suppose you conducted 45 sessions with the red box and60 sessions with the blue box. This
data sheet e gives you the number of yes responses to the survey for each session. Note that the two samples are different
sizes.
To determine whether this difference is significant, you need to find the standard deviation of the sample mean differences.
For this task, you'll use this formula for the standard deviation of sample mean differences.
OM - OM, = V +
영
In this formula, the subscripts M and My represent the means of the two samples, o and ozare the standard deviations of the
two populations, and n and nizare the sample sizes.
Part A
? Question
Use the spreadsheet's Average function (look under AutoSum in the Function menu) to calculate the means.
Enter the correct value in each box. Use numerals instead of words, and round each value to the nearest hundredth.
The mean value of people who would purchase the red box is
The mean value of people who would purchase the blue box is

Answers: 1


Another question on Mathematics
Mathematics, 21.06.2019 19:00
Identify the conclusion of the conditional statement. if you live in phoenix, then you live in arizona.
Answers: 1
Mathematics, 21.06.2019 19:30
Kyle and elijah are planning a road trip to california. their car travels 3/4 of a mile per min if they did not stop driving, how many miles could kyle and elijah drive in a whole day? ? 1 day = 24 hours. plzzz i will give you 100 points
Answers: 2
Mathematics, 21.06.2019 19:30
Asurvey of 2,000 doctors showed that an average of 3 out of 5 doctors use brand x aspirin.how many doctors use brand x aspirin
Answers: 1
Mathematics, 21.06.2019 20:30
List x1, x2, x3, x4 where xi is the left endpoint of the four equal intervals used to estimate the area under the curve of f(x) between x = 4 and x = 6. a 4, 4.5, 5, 5.5 b 4.5, 5, 5.5, 6 c 4.25, 4.75, 5.25, 5.75 d 4, 4.2, 5.4, 6
Answers: 1
You know the right answer?
As a member of the marketing team for a pasta manufacturer, you want to find out whether there's any...
Questions

Social Studies, 30.06.2019 06:30

History, 30.06.2019 06:30
Social Studies, 30.06.2019 06:30

History, 30.06.2019 06:30
Mathematics, 30.06.2019 06:30

Mathematics, 30.06.2019 06:30
Social Studies, 30.06.2019 06:30
Mathematics, 30.06.2019 06:30


Social Studies, 30.06.2019 06:30
Mathematics, 30.06.2019 06:30


