B) The graph of y = x2 – 2x + 5 is
drawn on the axes on the left.
Use the graph to estimate t...

Mathematics, 22.05.2021 16:30 vicbar1024
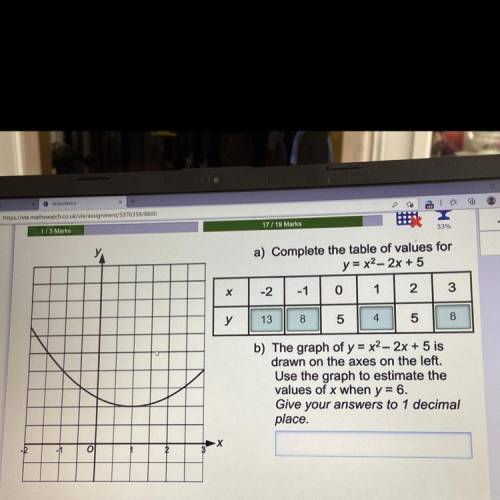
B) The graph of y = x2 – 2x + 5 is
drawn on the axes on the left.
Use the graph to estimate the
values of x when y = 6.
Give your answers to 1 decimal
place.
Please Help

Answers: 1


Another question on Mathematics
Mathematics, 21.06.2019 16:10
To find the extreme values of a function f(x.y) on a curve x-x(t), y y(t), treat f as a function of the single variable t and use the chain rule to find where df/dt is zero. in any other single-variable case, the extreme values of f are then found among the values at the critical points (points where df/dt is zero or fails to exist), and endpoints of the parameter domain. find the absolute maximum and minimum values of the following function on the given curves. use the parametric equations x=2cos t, y 2 sin t functions: curves: i) the semicircle x4,y20 i) the quarter circle x2+y-4, x20, y20 b, g(x,y)=xy
Answers: 2
Mathematics, 21.06.2019 20:40
Describe the symmetry of the figure. identify lines of symmetry, if any. find the angle and the order of any rotational symmetry.
Answers: 1
You know the right answer?
Questions


Social Studies, 18.08.2021 05:00


Mathematics, 18.08.2021 05:00

Social Studies, 18.08.2021 05:10

Mathematics, 18.08.2021 05:10


