
Mathematics, 24.05.2021 02:20 juliajaelyn9658
2A.8C
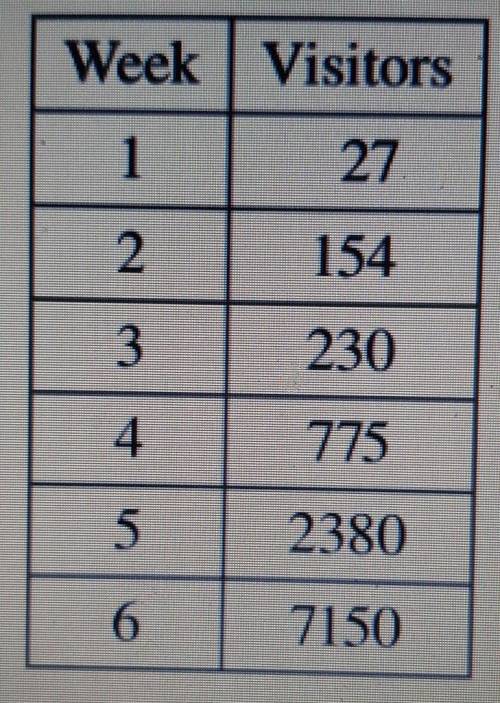
The chart below shows the number of visitors to a website during the first six weeks after its launch. Use an exponential regression equation that best models this data to predict the week when the website will have over one hundred thousand visitors.
A. week 8
B. week 9
C. week 7
D. week 10

Answers: 3


Another question on Mathematics
Mathematics, 21.06.2019 18:20
What are the solution(s) to the quadratic equation x2 – 25 = 0? o x = 5 and x = -5ox=25 and x = -25o x = 125 and x = -125o no real solution
Answers: 2
Mathematics, 21.06.2019 20:00
Solve for x and y a x= 13.3 y= 16.7 b x= 23.3 y= 12.5 c x= 7.5 y= 16.7 d x=7.5 y= 12.5
Answers: 1
Mathematics, 21.06.2019 21:00
Which expression is equal to (21)(7)(3x) using the associative property? (21 · 7 · 3)x (7)(21)(3x) 32(7 + 3x) (3x)(7)(21)
Answers: 2
Mathematics, 21.06.2019 22:20
In a young single person's monthly budget, $150 is spent on food, $175 is spent on housing, and $175 is spend on other items. suppose you drew a circle graph to represent this information, what percent of the graph represents housing?
Answers: 1
You know the right answer?
2A.8C
The chart below shows the number of visitors to a website during the first six weeks after it...
Questions


Biology, 25.06.2019 05:40

English, 25.06.2019 05:40


Social Studies, 25.06.2019 05:40

Spanish, 25.06.2019 05:40

Arts, 25.06.2019 05:40


