employment and the annual salaries of the

Mathematics, 24.05.2021 03:40 itssergioa
- 8.SP.1.1
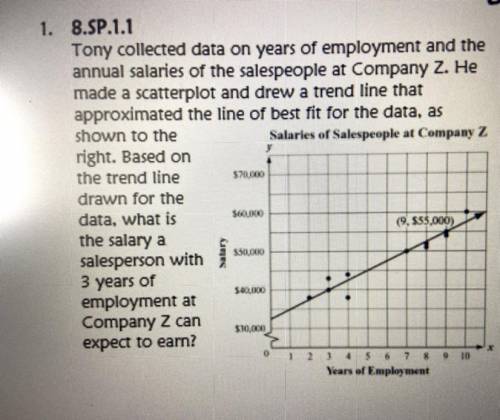
Tony collected data on the years of
employment and the annual salaries of the
salespeople at Company Z. He made a
scatterplot and drew a trend line that
approximated the line of best fit for the data, as
shown below. What is the slope of the trend
line that Tony drew? Show or explain how you
got your answer.
Salaries of Salespeople at Company Z
$71,500
$60.000
(9.555,000)
Salary
$50,000
500.000
$30,000
1 2 3 4 5 6 7 8 9 10
Years of Employment

Answers: 3


Another question on Mathematics
Mathematics, 21.06.2019 15:30
With: label the vertices and all the elements needed. find x
Answers: 2
Mathematics, 21.06.2019 22:00
Find the greatest common factor of the followig monomials 46g^2h and 34g^6h^6
Answers: 1
Mathematics, 21.06.2019 23:30
Segment wx is shown explain how you would construct a perpendicular bisector of wx using a compass and a straightedge
Answers: 3
Mathematics, 22.06.2019 00:30
Which equation can be solved to find one of the missing side lengths in the triangle? cos(60o) = cos(60o) = cos(60o) = cos(60o) = mark this and return
Answers: 3
You know the right answer?
- 8.SP.1.1
Tony collected data on the years of
employment and the annual salaries of the
employment and the annual salaries of the
Questions

Spanish, 18.03.2021 02:40

Computers and Technology, 18.03.2021 02:40

Mathematics, 18.03.2021 02:40

Biology, 18.03.2021 02:40
Mathematics, 18.03.2021 02:40

Mathematics, 18.03.2021 02:40
Mathematics, 18.03.2021 02:40

History, 18.03.2021 02:40
Computers and Technology, 18.03.2021 02:40
Mathematics, 18.03.2021 02:40
History, 18.03.2021 02:40
Spanish, 18.03.2021 02:40


