
Mathematics, 24.05.2021 19:20 skcats7353
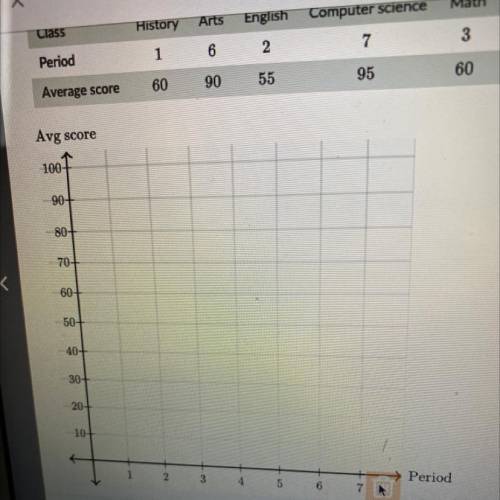
Garret collected data about exams in each of his classes from the previous year.
Plot the data in a scatter plot.
Class
History
Arts
English
Computer science
Math
Biology
Period
1
6
2
7
3
4
Average score
60
90
55
95
60
80

Answers: 3


Another question on Mathematics
Mathematics, 21.06.2019 17:00
What is the value of the expression 9+n/3-6 when n = 12? 1. 5. 7. 12.
Answers: 1
Mathematics, 21.06.2019 22:30
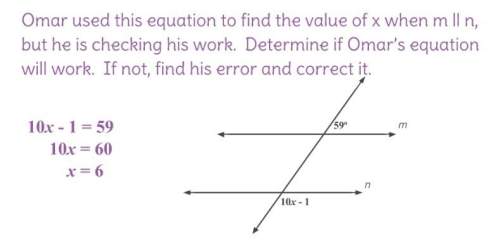
1.based of the diagrams what is the the value of x? 2.how would you verify your answer for x
Answers: 1
Mathematics, 22.06.2019 01:30
What is the value of x enter your answer in the box (3x+50
Answers: 2
Mathematics, 22.06.2019 02:00
Deena is planting two rectangular gardens. one garden is 3.67 feet by 8.56 feet, and the other garden is 3.67 feet by 7.45 feet. which expression does not respresent the total area in square feet of the two gardens
Answers: 2
You know the right answer?
Garret collected data about exams in each of his classes from the previous year.
Plot the data in a...
Questions

Computers and Technology, 15.07.2019 16:30


Geography, 15.07.2019 16:30


Biology, 15.07.2019 16:30
Mathematics, 15.07.2019 16:30
Biology, 15.07.2019 16:30

Social Studies, 15.07.2019 16:30
Biology, 15.07.2019 16:30
Chemistry, 15.07.2019 16:30


History, 15.07.2019 16:30

Arts, 15.07.2019 16:30
Biology, 15.07.2019 16:30


