
Mathematics, 24.05.2021 21:50 05eviebee
PLEASE HELP
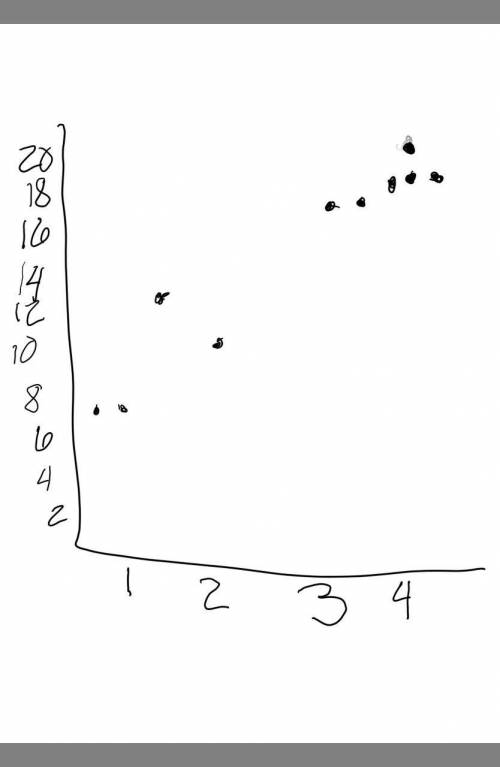
Describe how the line of best fit and the correlation coefficient can be used to determine the correlation between the two variables on your graph.
Describe the type of correlation between the two variables on your graph. How do you know?
Does the correlation between the variables imply causation? Explain.
How do you calculate the residuals for a scatterplot?
Calculate the residuals for your scatterplot in step 2d.

Answers: 3


Another question on Mathematics
Mathematics, 21.06.2019 18:00
Acompany wants to reduce the dimensions of its logo by one fourth to use on business cards. if the area of the original logo is 4 square inches, what is the area of the logo that will be used on the business cards?
Answers: 1
Mathematics, 21.06.2019 19:00
Asmall business produces and sells balls. the fixed costs are $20 and each ball costs $4.32 to produce. each ball sells for $8.32. write the equations for the total cost, c, and the revenue, r, then use the graphing method to determine how many balls must be sold to break even.
Answers: 3
Mathematics, 21.06.2019 19:30
Asurvey of 2,000 doctors showed that an average of 3 out of 5 doctors use brand x aspirin.how many doctors use brand x aspirin
Answers: 1
You know the right answer?
PLEASE HELP
Describe how the line of best fit and the correlation coefficient can be used to determ...
Questions


History, 02.07.2019 15:00

Biology, 02.07.2019 15:00
Mathematics, 02.07.2019 15:00
History, 02.07.2019 15:00

Social Studies, 02.07.2019 15:00
English, 02.07.2019 15:00
English, 02.07.2019 15:00
Mathematics, 02.07.2019 15:00
Mathematics, 02.07.2019 15:00
Biology, 02.07.2019 15:00


