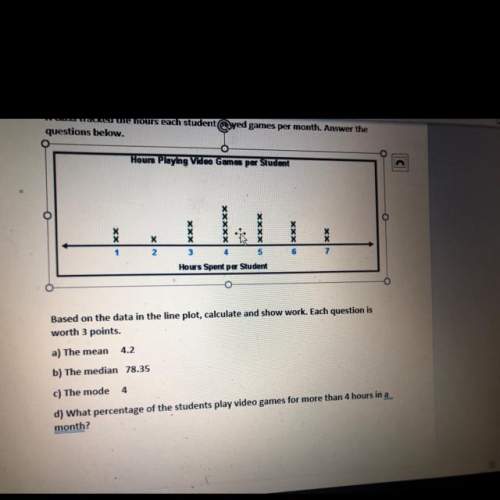
PLEASE HELP M
Todd created a box plot based on this data set:
41 50 51 52 52 52 52 52 60 60 6...

Mathematics, 24.05.2021 23:50 avree9815
PLEASE HELP M
Todd created a box plot based on this data set:
41 50 51 52 52 52 52 52 60 60 61 68 75 90
He later realized all the 52s should have been 62s, so he redid his box plot. Which values increased by 10? Select all that apply.
a. the median
b. the interquartile range
c. the difference between the median and the lowest value
d. the upper quartile
e. the lower quartile

Answers: 1


Another question on Mathematics
Mathematics, 21.06.2019 16:00
If there is no real number solution to the quadratic equation x^2+2x+c=0 what is a possible value of c? 1 -2 0 3
Answers: 2
Mathematics, 21.06.2019 17:00
If a baby uses 15 diapers in 2 days, how many diapers will the baby use in a year?
Answers: 2
Mathematics, 21.06.2019 18:30
How do you create a data set with 8 points in it that has a mean of approximately 10 and a standard deviation of approximately 1?
Answers: 1
You know the right answer?
Questions

English, 21.05.2020 06:04
Mathematics, 21.05.2020 06:04
Mathematics, 21.05.2020 06:04

History, 21.05.2020 06:04
Mathematics, 21.05.2020 06:04
English, 21.05.2020 06:04

Biology, 21.05.2020 06:04

Mathematics, 21.05.2020 06:04
Mathematics, 21.05.2020 06:04

Mathematics, 21.05.2020 06:04
Biology, 21.05.2020 06:04

Chemistry, 21.05.2020 06:04


