
Mathematics, 25.05.2021 01:00 hany90
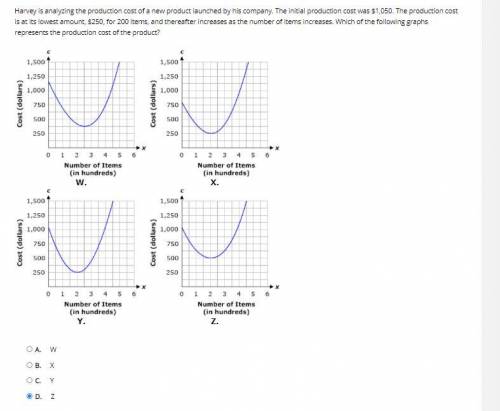
Harvey is analyzing the production cost of a new product launched by his company. The initial production cost was $1,050. The production cost is at its lowest amount, $250, for 200 items, and thereafter increases as the number of items increases. Which of the following graphs represents the production cost of the product?

Answers: 1


Another question on Mathematics
Mathematics, 21.06.2019 18:00
Find the slope and the y-intercept if there's one and the equation of the line given these two points( 3, 2) and( 3, -4)
Answers: 2
Mathematics, 21.06.2019 23:30
Without multiplying, tell which product is larger and why. 5 × 1/3 or 5 × 2/3 a)5 × 1/3 because 1/3 is less than 2/3 b) 5 × 1/3 because 1/3 is greater than 2/3 c) 5 × 2/3 because 1/3 is less than 23 d) 5 × 23 because 1/3 is greater than 2/3
Answers: 1
Mathematics, 21.06.2019 23:30
In the diagram, ab is tangent to c, ab = 4 inches, and ad = 2 inches. find the radius of the circle.
Answers: 2
Mathematics, 22.06.2019 04:00
The bottom of ignacio's desktop is 74.5cm from the floor. ignacio's sits in his adjustable chair, and the tops of his legs are 49.3cm from the floor. each clockwise rotation of the knob on the chair raises ignacio's legs by 4.8cm. write an inequality to determine the number of clockwise rotations, r, ignacio could make with the knob without his legs touching the desk
Answers: 1
You know the right answer?
Harvey is analyzing the production cost of a new product launched by his company. The initial produc...
Questions
Mathematics, 25.03.2021 18:40


Mathematics, 25.03.2021 18:40
English, 25.03.2021 18:40

History, 25.03.2021 18:40
Mathematics, 25.03.2021 18:40

Social Studies, 25.03.2021 18:40
English, 25.03.2021 18:40
Mathematics, 25.03.2021 18:40
Social Studies, 25.03.2021 18:40

Mathematics, 25.03.2021 18:40


