
Mathematics, 25.05.2021 17:10 precioushayhay
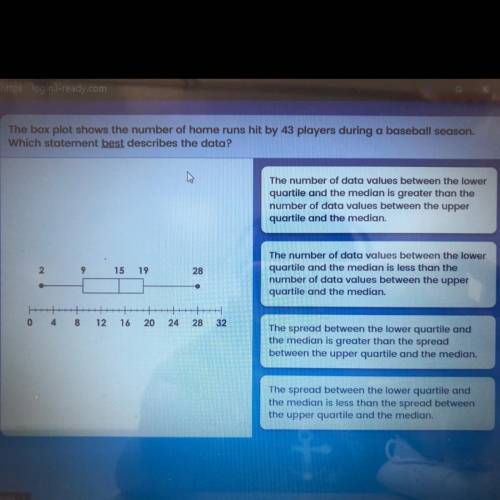
The box plot shows the number of home runs hit by 43 players during a baseball season.
Which statement best describes the data?
The number of data values between the lower
quartile and the median is greater than the
number of data values between the upper
quartile and the median
18 19
28
The number of data values between the lower
quartile and the median is less than the
number of data values between the upper
quartile and the median
0 4 8 12 16 20 24 28 32
The spread between the lower quartile and
the median is greater than the spread
between the upper quartile and the median.
The spread between the lower quartile and
the median is less than the spread between
the upper quartile and the median

Answers: 3


Another question on Mathematics
Mathematics, 21.06.2019 16:00
Planning for the possibility that your home might get struck by lighting and catch on fire is part of a plan
Answers: 1
Mathematics, 21.06.2019 16:20
Find the slope of the line that contains the following points. r(-2, 4), s(6, -2)
Answers: 1
Mathematics, 21.06.2019 18:00
How many triangles can be drawn with side lengths 4 centimeters, 4.5 centimeters, and 9 centimeters? explain
Answers: 1
Mathematics, 21.06.2019 19:30
Which describes the difference between the graph of f(x)=x^2 and g(x)=-(x^2-2)
Answers: 1
You know the right answer?
The box plot shows the number of home runs hit by 43 players during a baseball season.
Which statem...
Questions


Computers and Technology, 10.09.2020 03:01

History, 10.09.2020 03:01


Mathematics, 10.09.2020 03:01
Mathematics, 10.09.2020 03:01
Mathematics, 10.09.2020 03:01
Mathematics, 10.09.2020 03:01

Chemistry, 10.09.2020 03:01
Mathematics, 10.09.2020 03:01


