
Mathematics, 25.05.2021 18:20 gudtavosanchez19
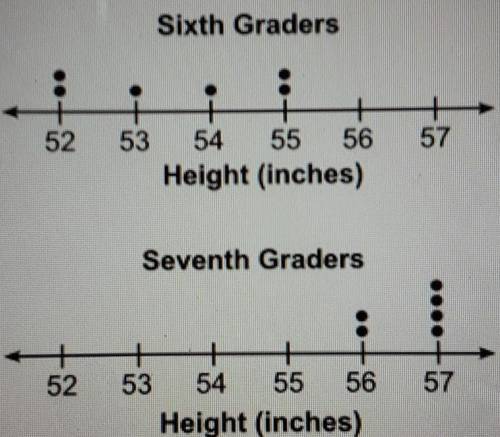
The two dot plots below show the helghts of some sixth graders and some seventh .The mean absolute deviation (MAD) for the first set of data is 1.2 and the MAD for the second set of data is 04. Approximately how many times the vanability in the heights of the seventh graders is the variability in the heights of the shath graders? (Round all values to the tenths place.)

Answers: 3


Another question on Mathematics
Mathematics, 20.06.2019 18:02
This is a table of values that follows a given rule or function. each output comes from the input being applied to the rule.
Answers: 1
Mathematics, 21.06.2019 16:20
Taking algebra two apex courses and need with these questions
Answers: 1
Mathematics, 21.06.2019 19:00
{0,1,2,3,4,5,6,20,21,22,23,24,25} the distribution is considered to be: skewed the right, skewed the left, not skewed?
Answers: 1
Mathematics, 21.06.2019 21:00
You buy five cds at a sale for $5.95 each. write an expression for the total cost of the cds.then use the distributive property and mental math to evaluate the expression.
Answers: 2
You know the right answer?
The two dot plots below show the helghts of some sixth graders and some seventh .The mean absolute d...
Questions
Mathematics, 28.10.2020 09:50

Business, 28.10.2020 09:50

Advanced Placement (AP), 28.10.2020 09:50
Mathematics, 28.10.2020 09:50

Mathematics, 28.10.2020 09:50

Biology, 28.10.2020 09:50
Mathematics, 28.10.2020 09:50
Mathematics, 28.10.2020 09:50

Computers and Technology, 28.10.2020 09:50


English, 28.10.2020 09:50


