
Mathematics, 25.05.2021 20:20 lilisncz
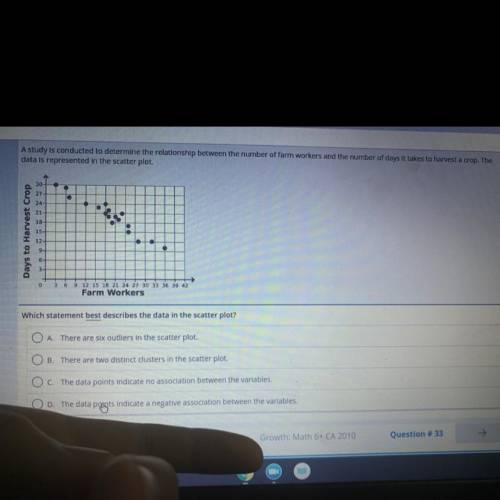
A study is conducted to determine the relationship between the number of farm workers and the number of days it takes to
data is represented in the scatter plot
30-
27-
0
24-
21
18
18
Days to Harvest Crop
15-
12
6-
0
3 6
9
12 15 18 21 24 27 30 33 36 39 42
Farm Workers
Which statement best describes the data in the scatter plot?
O A. There are six outliers in the scatter plot.
B. There are two distinct clusters in the scatter plot.
O c. The data points indicate no association between the variables.
OD. The data poigts indicate a negative association between the variables.

Answers: 2


Another question on Mathematics
Mathematics, 21.06.2019 20:00
The distribution of the amount of money spent by students for textbooks in a semester is approximately normal in shape with a mean of $235 and a standard deviation of $20. according to the standard deviation rule, how much did almost all (99.7%) of the students spend on textbooks in a semester?
Answers: 2
Mathematics, 21.06.2019 21:00
Which zero pair could be added to the function f(x) = x2 + 12x + 6 so that the function can be written in vertex form? o 3, -3o 6,629,-936, 36
Answers: 3
Mathematics, 21.06.2019 22:00
How many ordered pairs of positive integers satisfy xy=32?
Answers: 1
Mathematics, 21.06.2019 23:30
Find the directions in which the function increases and decreases most rapidly at upper p 0p0. then find the derivatives of the function in these directions. f(x,y)equals=x squared plus xy plus y squaredx2+xy+y2, upper p 0p0left parenthesis 1 comma negative 4 right parenthesis
Answers: 2
You know the right answer?
A study is conducted to determine the relationship between the number of farm workers and the number...
Questions


History, 05.12.2021 20:10

English, 05.12.2021 20:10
Physics, 05.12.2021 20:10
English, 05.12.2021 20:10

English, 05.12.2021 20:10

Spanish, 05.12.2021 20:10
Mathematics, 05.12.2021 20:10


