
Mathematics, 26.05.2021 19:20 zarzuba
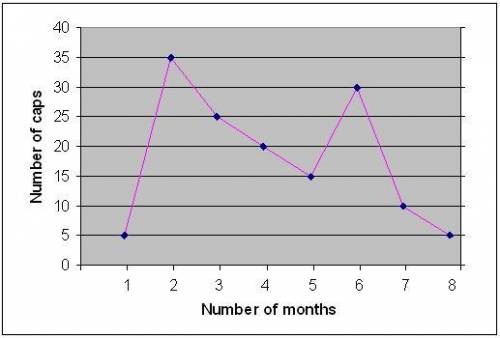
The graph shows the number of baseball caps produced by a company over 8 months. Estimate the total number of caps produced by taking the midpoint rule with 8 subintervals.
A.
290
B.
145
C.
135
D.
120

Answers: 3


Another question on Mathematics
Mathematics, 22.06.2019 00:00
The amount cami raised during last year’s charity walk, $45.50, is 7/10 of the amount she raised this year. which equation represents n, the number of dollars she raised this year?
Answers: 2
Mathematics, 22.06.2019 01:10
|z| > (1/2) {-1/2, 1/2} {z|(-1/2) < z < (1/2)} {z|z < (-1/2) ∪ z > (1/2)}
Answers: 3
Mathematics, 22.06.2019 04:30
Ribbon a is 1/3 meters long. it is 2/5 meters shorter than ribbon b. what's the total length of 2 ribbons?
Answers: 1
Mathematics, 22.06.2019 05:40
Abookstore owner is having a sale the book bart wants was originally priced at $14.99 the book is now $10.04 by what percentage was the price reduced
Answers: 1
You know the right answer?
The graph shows the number of baseball caps produced by a company over 8 months. Estimate the total...
Questions

Biology, 16.03.2022 17:20


Spanish, 16.03.2022 17:20
Mathematics, 16.03.2022 17:20
Mathematics, 16.03.2022 17:20
Mathematics, 16.03.2022 17:20
Mathematics, 16.03.2022 17:20
English, 16.03.2022 17:20

Social Studies, 16.03.2022 17:20
Social Studies, 16.03.2022 17:20

Business, 16.03.2022 17:20


