
Mathematics, 26.05.2021 21:20 xxxharveyweinsteinxx
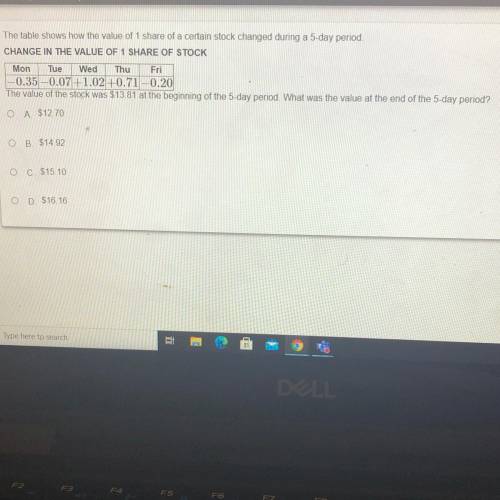
The table shows how the value of 1 share of a certain stock changed during a 5-day period.
CHANGE IN THE VALUE OF 1 SHARE OF STOCK
Mon Tue Wed Thu Fri
-0.35 -0.07+1.02 +0.71–0.20
The value of the stock was $13.81 at the beginning of the 5-day period. What was the value at the end of the 5-day period?
O A $12.70
B. $14.92
OC $15.10
O
D. $16.16
yes

Answers: 1


Another question on Mathematics
Mathematics, 21.06.2019 17:00
Acar travels at an average speed of 52 miles per hour. how long does it take to travel 299 miles
Answers: 1
Mathematics, 21.06.2019 20:00
Guys i need ! graded assignment grade 8 checkpoint 2, part 2 answer the questions below. when you are finished, submit this assignment to your teacher by the due date for full credit. total score: of 9 points (score for question 1: of 4 points) 1. the cost of renting a car for a day is $0.50 per mile plus a $15 flat fee. (a) write an equation to represent this relationship. let x be the number of miles driven and y be the total cost for the day. (b) what does the graph of this equation form on a coordinate plane? explain. (c) what is the slope and the y-intercept of the graph of the relationship? explain.
Answers: 1
You know the right answer?
The table shows how the value of 1 share of a certain stock changed during a 5-day period.
CHANGE I...
Questions


Spanish, 08.12.2020 07:10


Mathematics, 08.12.2020 07:10
English, 08.12.2020 07:10


