
Mathematics, 26.05.2021 22:00 grettelyesenia
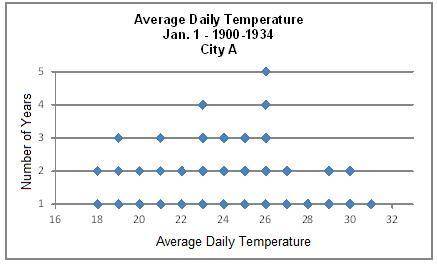
The graph below shows the average daily temperatures on January 1 from 1900 to 1934 for city A. The mean of the temperatures in the chart is 24° with standard deviation of 4°. How many years had temperatures within one standard deviation of the mean?
Answers: 20, 25, 28, 35
TIMED HELP QUICKLY PLEASE!!! 20 pts

Answers: 1


Another question on Mathematics
Mathematics, 21.06.2019 19:30
Asurvey of 2,000 doctors showed that an average of 3 out of 5 doctors use brand x aspirin.how many doctors use brand x aspirin
Answers: 1
Mathematics, 21.06.2019 22:00
If x+y+z=0 what is the value of [tex] {x}^{3} + {y}^{3} + {z}^{3} [/tex]
Answers: 2
Mathematics, 21.06.2019 22:40
Afunction g(x) has x-intercepts at (, 0) and (6, 0). which could be g(x)? g(x) = 2(x + 1)(x + 6) g(x) = (x – 6)(2x – 1) g(x) = 2(x – 2)(x – 6) g(x) = (x + 6)(x + 2)
Answers: 1
Mathematics, 21.06.2019 23:00
Square a has a side length of (2x-7) and square b has a side length of (-4x+18). how much bigger is the perimeter of square b than square a?and show all work! you so
Answers: 2
You know the right answer?
The graph below shows the average daily temperatures on January 1 from 1900 to 1934 for city A. The...
Questions
Mathematics, 06.02.2021 07:50

Geography, 06.02.2021 07:50


Biology, 06.02.2021 07:50

Computers and Technology, 06.02.2021 07:50
Mathematics, 06.02.2021 07:50
Mathematics, 06.02.2021 07:50
Mathematics, 06.02.2021 07:50
Mathematics, 06.02.2021 07:50

English, 06.02.2021 07:50

Mathematics, 06.02.2021 07:50
Mathematics, 06.02.2021 07:50

Mathematics, 06.02.2021 07:50


