
Mathematics, 27.05.2021 23:50 hamilclips6805
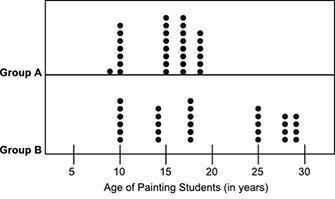
The dot plots below show the ages of students belonging to two groups of painting classes:
A dot plot shows two divisions labeled Group A and Group B. The horizontal axis is labeled as Age of Painting Students in years. Group A shows 1 dot at 9, 7 dots at 10, 8 dots at 15, 8 dots at 17, and 6 dots at 19. Group B shows 6 dots at 10, 5 dots at 14, 6 dots at 18, 5 dots at 25, 4 dots at 28, and 4 dots at 29.
Based on visual inspection, which group most likely has a lower mean age of painting students? Explain your answer using two or three sentences. Make sure to use facts to support your answer.

Answers: 3


Another question on Mathematics
Mathematics, 21.06.2019 17:40
Given f(x)= 9x+1 and g(x)=x^3, choose the expression (f*g)(x)
Answers: 2
Mathematics, 21.06.2019 19:30
Complete the solution of the equation. find the value of y when x equals to 28 x+3y=28
Answers: 2
Mathematics, 22.06.2019 00:00
Can someone plz me understand how to do these. plz, show work.in exercises 1-4, rewrite the expression in rational exponent form.[tex]\sqrt[4]{625} \sqrt[3]{512} (\sqrt[5]{4} )³ (\sqrt[4]{15} )^{7}\\ (\sqrt[3]{27} )^{2}[/tex]
Answers: 3
You know the right answer?
The dot plots below show the ages of students belonging to two groups of painting classes:
A dot pl...
Questions

Arts, 09.02.2021 03:50


History, 09.02.2021 04:00
History, 09.02.2021 04:00
Mathematics, 09.02.2021 04:00
Arts, 09.02.2021 04:00
Mathematics, 09.02.2021 04:00
Mathematics, 09.02.2021 04:00
Mathematics, 09.02.2021 04:00
Mathematics, 09.02.2021 04:00


