
Mathematics, 28.05.2021 01:00 shakira11harvey6
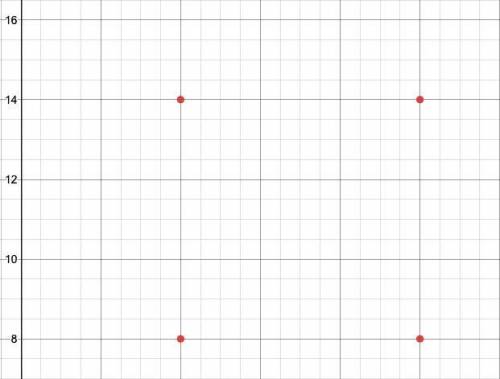
the coordiantes of three vertices of a square are (4,14), (10,14), and (4,8). what are the coordinates of the missing vertex

Answers: 2


Another question on Mathematics
Mathematics, 21.06.2019 22:00
James is playing his favorite game at the arcade. after playing the game 33 times, he has 88 tokens remaining. he initially had 2020 tokens, and the game costs the same number of tokens each time. the number tt of tokens james has is a function of gg, the number of games he plays
Answers: 1
Mathematics, 22.06.2019 02:30
According to a research study, parents with young children slept 6.4 hours each night last year, on average. a random sample of 18 parents with young children was surveyed and the mean amount of time per night each parent slept was 6.8. this data has a sample standard deviation of 0.9. (assume that the scores are normally distributed.) researchers conduct a one-mean hypothesis at the 5% significance level, to test if the mean amount of time parents with young children sleep per night is greater than the mean amount of time last year. the null and alternative hypotheses are h0: μ=6.4 and ha: μ> 6.4, which is a right-tailed test. the test statistic is determined to be t0=1.89 using the partial t-table below, determine the critical value(s). if there is only one critical value, leave the second answer box blank.
Answers: 3
Mathematics, 22.06.2019 03:00
Describe how the presence of possible outliers might be identified on the following. (a) histograms gap between the first bar and the rest of bars or between the last bar and the rest of bars large group of bars to the left or right of a gap higher center bar than surrounding bars gap around the center of the histogram higher far left or right bar than surrounding bars (b) dotplots large gap around the center of the data large gap between data on the far left side or the far right side and the rest of the data large groups of data to the left or right of a gap large group of data in the center of the dotplot large group of data on the left or right of the dotplot (c) stem-and-leaf displays several empty stems in the center of the stem-and-leaf display large group of data in stems on one of the far sides of the stem-and-leaf display large group of data near a gap several empty stems after stem including the lowest values or before stem including the highest values large group of data in the center stems (d) box-and-whisker plots data within the fences placed at q1 â’ 1.5(iqr) and at q3 + 1.5(iqr) data beyond the fences placed at q1 â’ 2(iqr) and at q3 + 2(iqr) data within the fences placed at q1 â’ 2(iqr) and at q3 + 2(iqr) data beyond the fences placed at q1 â’ 1.5(iqr) and at q3 + 1.5(iqr) data beyond the fences placed at q1 â’ 1(iqr) and at q3 + 1(iqr)
Answers: 1
Mathematics, 22.06.2019 07:10
Find the length (perimeter) of the region inside the polar cur 9. polar curve r = 9
Answers: 3
You know the right answer?
the coordiantes of three vertices of a square are (4,14), (10,14), and (4,8). what are the coordinat...
Questions
Mathematics, 30.06.2021 22:20
Mathematics, 30.06.2021 22:20
Mathematics, 30.06.2021 22:20

Computers and Technology, 30.06.2021 22:30

Chemistry, 30.06.2021 22:30

Geography, 30.06.2021 22:30

English, 30.06.2021 22:30

History, 30.06.2021 22:30
Mathematics, 30.06.2021 22:30
English, 30.06.2021 22:30

Mathematics, 30.06.2021 22:30


