The graph shows a Normal distribution
The mean of this Normal distribution, to the nearest
te...

Mathematics, 30.05.2021 08:00 kelleemaebarnha
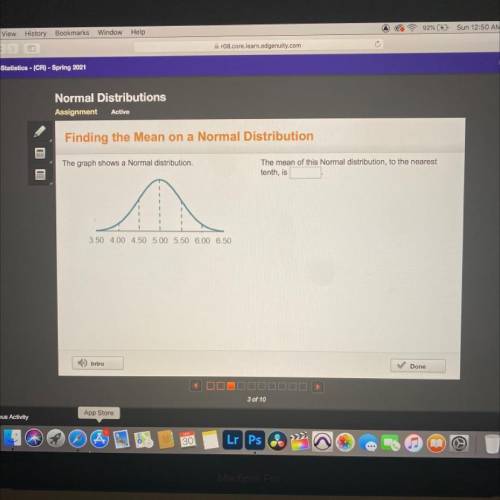
The graph shows a Normal distribution
The mean of this Normal distribution, to the nearest
tenth, is
1
.
.
3.50 4.00 4.50 5.00 5.50 6.00 6.50

Answers: 2


Another question on Mathematics
Mathematics, 21.06.2019 20:30
The interior angles formed by the side of a hexagon have measures of them up to 720° what is the measure of angle a
Answers: 2
Mathematics, 22.06.2019 04:50
The random variable x has probability density function f (x) = k(−x²+5x−4) 1 ≤ x ≤ 4 or =0 1 show that k = 2/9 find 2 e(x), 3 the mode of x, 4 the cumulative distribution function f(x) for all x. 5 evaluate p(x ≤ 2.5). 6 deduce the value of the median and comment on the shape of the distribution.
Answers: 3
You know the right answer?
Questions

Mathematics, 09.02.2021 23:00

Advanced Placement (AP), 09.02.2021 23:00


Mathematics, 09.02.2021 23:00

Biology, 09.02.2021 23:00

Biology, 09.02.2021 23:00
Mathematics, 09.02.2021 23:00

Chemistry, 09.02.2021 23:00

Engineering, 09.02.2021 23:00
Mathematics, 09.02.2021 23:00


