1. What type of correlation does the graph show?
2. What is the strength of the correlation?
...

Mathematics, 30.05.2021 23:00 Dexter992
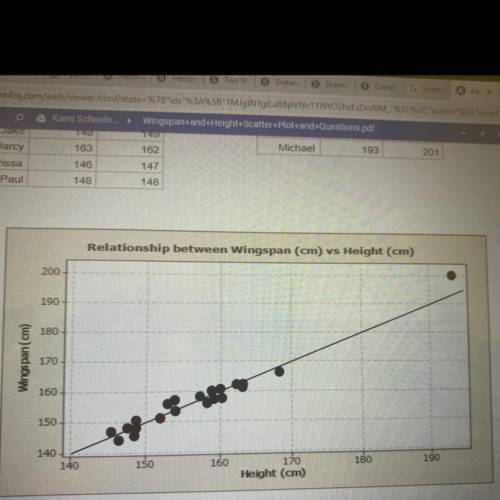
1. What type of correlation does the graph show?
2. What is the strength of the correlation?
3. Is there a cluster or outliers, if so describe where they are located.
4. Draw the best fit line. What is the equation of the best fit line?
PLEASE ANSWER ASAP I WILL GIVE BRAINLIEST

Answers: 2


Another question on Mathematics
Mathematics, 21.06.2019 21:40
Question 1 of 10 2 points different groups of 50 graduates of an engineering school were asked the starting annual salary for their first engineering job after graduation, and the sampling variability was low. if the average salary of one of the groups was $65,000, which of these is least likely to be the average salary of another of the groups? o a. $64,000 o b. $65,000 o c. $67,000 o d. $54,000
Answers: 2
Mathematics, 21.06.2019 22:30
Micheal is 4 times as old as brandon and is also 27 years older than brandon. how old is micheal
Answers: 2
Mathematics, 22.06.2019 01:00
First work with stencil one. use a combination of reflections, rotations, and translations to see whether stencil one will overlap with the original pattern. list the sequence of rigid transformations you used in your attempt, noting the type of transformation, the direction, the coordinates, and the displacement in
Answers: 3
You know the right answer?
Questions
Mathematics, 28.05.2021 17:50

Chemistry, 28.05.2021 17:50
Mathematics, 28.05.2021 17:50
Mathematics, 28.05.2021 17:50


Chemistry, 28.05.2021 17:50
Mathematics, 28.05.2021 17:50


English, 28.05.2021 17:50

Law, 28.05.2021 17:50


