Mathematics, 31.05.2021 14:00 kob3965
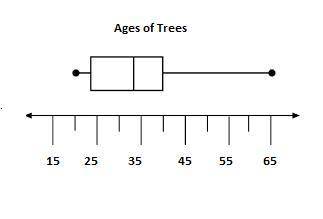
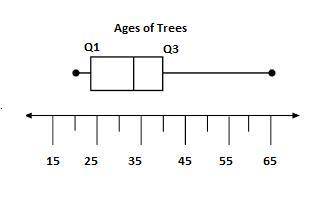
He box-and-whisker plot below shows the distribution of the ages, in years, of the trees in the Gordons' back yard. The title of the box and whisker plot is, Ages of Trees. The number line is labeled, age, in years, and ranges from 15 to 65. Based on the data shown in the box-and-whisker plot above, what is the interquartile range of the ages, in years, of the trees? Respond in the space provided. If your test is on paper, write your answer on the answer she

Answers: 1


Another question on Mathematics


Mathematics, 21.06.2019 22:10
Atype of plant is introduced into an ecosystem and quickly begins to take over. a scientist counts the number of plants after mmonths and develops the equation p(m)= 19.3(1.089)^m to model the situation. most recently, the scientist counted 138 plants.assuming there are no limiting factors to the growth of the plants, about how many months have passed since the plants werefirst introduced? a)o 6.1b)0.6.6c)10 72d)o 23.1
Answers: 3

Mathematics, 22.06.2019 00:00
Apassenger train and a freight train leave san jose at 3pm, traveling in the same direction. the passenger train is going three times as fast as the freight train. at 6pm they are 240 miles apart. how fast is each travelling? explain your answer and show your
Answers: 1
You know the right answer?
He box-and-whisker plot below shows the distribution of the ages, in years, of the trees in the Gord...
Questions


Mathematics, 27.08.2019 12:00


Mathematics, 27.08.2019 12:00

History, 27.08.2019 12:00


English, 27.08.2019 12:00


Mathematics, 27.08.2019 12:00

English, 27.08.2019 12:00

Mathematics, 27.08.2019 12:00

History, 27.08.2019 12:00


