
Mathematics, 31.05.2021 15:30 soupsah8166
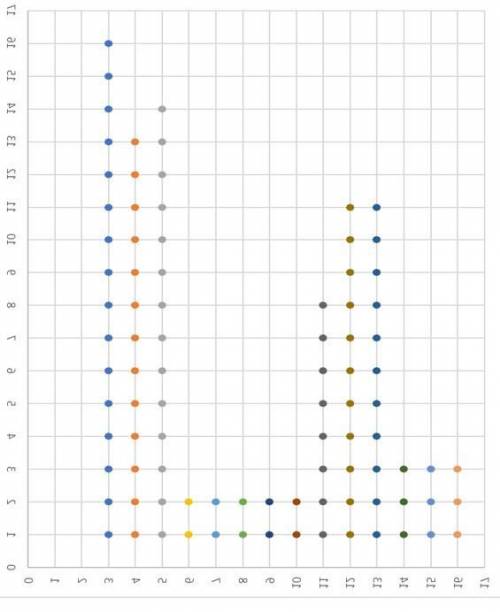
Mitch made a dot plot of the number of hours that students in his grade spent this week watching television.
Use the data to choose True or False for each statement.
Dot plot named as
A typical student from this group spends more than 10 hours watching television each week.
More students watch 3 hours of television than watch more than 3 hours of television.
All students watch 20 or fewer hours of television each week.
The most common answer for the number of hours that a student watches per week was 3.

Answers: 3


Another question on Mathematics
Mathematics, 21.06.2019 18:40
The vertex of this parabola is at (-2,-3). when the x-value is -1, the y-value is -5. what is the coefficient of the squared expression in the parabola's equation?
Answers: 2
Mathematics, 21.06.2019 21:50
Ab and bc are tangent to circle d. find x is ab = 3x + 8 and bc = 26. find x
Answers: 1
Mathematics, 21.06.2019 22:30
Ron has 8 caps and 4 of his caps are blue. thes rest of his cap are red. how many of ron's caps are red
Answers: 1
You know the right answer?
Mitch made a dot plot of the number of hours that students in his grade spent this week watching tel...
Questions
Mathematics, 17.11.2020 21:10

Physics, 17.11.2020 21:10

Social Studies, 17.11.2020 21:10

SAT, 17.11.2020 21:10


English, 17.11.2020 21:10
Mathematics, 17.11.2020 21:10
Mathematics, 17.11.2020 21:10

Mathematics, 17.11.2020 21:10
Mathematics, 17.11.2020 21:10
Mathematics, 17.11.2020 21:10
History, 17.11.2020 21:10
Business, 17.11.2020 21:10


