Question 8 of 10
For which sample size (n) and sample proportion () can a normal curve be
use...

Mathematics, 02.06.2021 06:10 helen3327
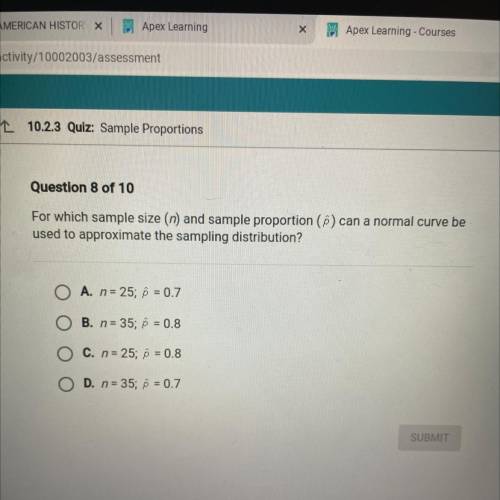
Question 8 of 10
For which sample size (n) and sample proportion () can a normal curve be
used to approximate the sampling distribution?
A. n = 25; p = 0.7
B. n = 35; p = 0.8
C. n = 25; 6 = 0.8
D. n = 35; 6 = 0.7

Answers: 1


Another question on Mathematics
Mathematics, 21.06.2019 12:40
An electronics manufacturer wants to know if customers would be interested in a detachable keyboard for their tables and if so, what the most important features would be. the manufacturer partners with an electronics store to include copies of the survey with every purchase at that store for one week. which of the following best explains why this random sample is unlikely to be a good representative sample of tablet owners' preferences for a detachable keyboard? a) one week is likely not enough time to get a large enough sample. b) most people won't bother to send in the survey, which is likely to skew the results c) there is no way to verify whether the responders to the survey actually own a tablet d) the survey is biased because it was conducted through an electronics store, not the general population
Answers: 2
Mathematics, 21.06.2019 14:30
"you know, playing tennis is healthier than watching a tennis match on television," katya remarked to her couch potato brother. in this sentence, healthier is a/an a. superlative. b. comparative. c. positive form. d. adverb.
Answers: 2
Mathematics, 21.06.2019 16:30
Jorge planted flowers in his garden he planted one row of 12 tulips and one row of 36 daisies george's friend kylie has a garden with 75 flowers in it kylie's garden only contains tulips and daisies. is it possible for kylie‘s garden she have the same ratio of tulips to daisies as george's garden?
Answers: 1
Mathematics, 21.06.2019 17:30
Lems1. the following data set represents the scores on intelligence quotient(iq) examinations of 40 sixth-grade students at a particular school: 114, 122, 103, 118, 99, 105, 134, 125, 117, 106, 109, 104, 111, 127,133, 111, 117, 103, 120, 98, 100, 130, 141, 119, 128, 106, 109, 115,113, 121, 100, 130, 125, 117, 119, 113, 104, 108, 110, 102(a) present this data set in a frequency histogram.(b) which class interval contains the greatest number of data values? (c) is there a roughly equal number of data in each class interval? (d) does the histogram appear to be approximately symmetric? if so,about which interval is it approximately symmetric?
Answers: 3
You know the right answer?
Questions


History, 02.08.2019 15:00


Mathematics, 02.08.2019 15:00
History, 02.08.2019 15:00


Geography, 02.08.2019 15:00


Mathematics, 02.08.2019 15:00


