
Mathematics, 02.06.2021 06:10 khyjah74
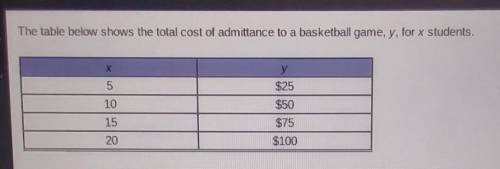
Which explains how the table can be used to predict the cost of any number of students attending the game?
A. The table is a partial representation of a larger data set. It can be used to generate a graph that is a complete representation of the data set.
B. The table is a partial representation of a larger data set. It can be used to generate an equation that is a complete representation of the data set.
C. The table is a complete representation of the data set. To determine the cost of any number of students, find the number of students in the x-column.
D. The table is a complete representation of the data set. To determine the cost of any number of students, find the number of students in the y-column.

Answers: 2


Another question on Mathematics
Mathematics, 22.06.2019 00:30
The value, v, of kalani’s stock investments over a time period, x, can be determined using the equation v=750(0.80)^-x. what is the rate of increase or decrease associated with this account? 20% decrease 20% increase 25% decrease 25% increase
Answers: 1
Mathematics, 22.06.2019 01:00
Suppose your sat score is 2040. a college with an average sat score for admintted students of which of these would most likely be your best option?
Answers: 1
Mathematics, 22.06.2019 01:30
Aresearch study is done to find the average age of all u.s. factory workers. the researchers asked every factory worker in ohio what their birth year is. this research is an example of a census survey convenience sample simple random sample
Answers: 2
You know the right answer?
Which explains how the table can be used to predict the cost of any number of students attending the...
Questions

Computers and Technology, 27.06.2019 01:30

Mathematics, 27.06.2019 01:30

Mathematics, 27.06.2019 01:30
Mathematics, 27.06.2019 01:30

Chemistry, 27.06.2019 01:30

Mathematics, 27.06.2019 01:30
English, 27.06.2019 01:30


