Which graph is the graph of this function?
5
if -3 << -2
{
-if-2 < I<...

Mathematics, 02.06.2021 21:30 kayleeblanton1132
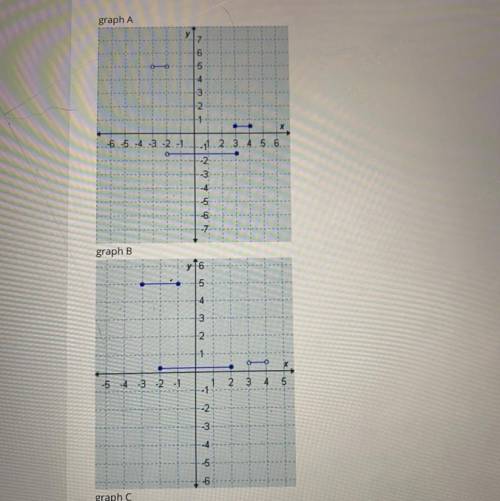
Which graph is the graph of this function?
5
if -3 << -2
{
-if-2 < I<3
if 3
OA.
graph A
OB.
graph B
O c. graph
OD
graph D

Answers: 1


Another question on Mathematics
Mathematics, 21.06.2019 17:30
Write an expression that has three terms and simplifies to 4x - 7. identify the coefficient(s) and constant(s) in your expression
Answers: 1
Mathematics, 21.06.2019 18:20
17. a researcher measures three variables, x, y, and z for each individual in a sample of n = 20. the pearson correlations for this sample are rxy = 0.6, rxz = 0.4, and ryz = 0.7. a. find the partial correlation between x and y, holding z constant. b. find the partial correlation between x and z, holding y constant. (hint: simply switch the labels for the variables y and z to correspond with the labels in the equation.) gravetter, frederick j. statistics for the behavioral sciences (p. 526). cengage learning. kindle edition.
Answers: 2
Mathematics, 21.06.2019 21:10
If f(x) and g(x) are inverse functions of each other, which of the following shows the graph of f(g(x)
Answers: 1
Mathematics, 21.06.2019 21:30
The map shows the location of the airport and a warehouse in a city. though not displayed on the map, there is also a factory 112 miles due north of the warehouse.a truck traveled from the warehouse to the airport and then to the factory. what is the total number of miles the truck traveled?
Answers: 3
You know the right answer?
Questions
Mathematics, 15.07.2020 09:01

English, 15.07.2020 09:01
Mathematics, 15.07.2020 09:01


Chemistry, 15.07.2020 09:01

History, 15.07.2020 09:01

Spanish, 15.07.2020 09:01

Health, 15.07.2020 09:01
Spanish, 15.07.2020 09:01

English, 15.07.2020 09:01
Spanish, 15.07.2020 09:01
Mathematics, 15.07.2020 09:01
Mathematics, 15.07.2020 09:01
Spanish, 15.07.2020 09:01


