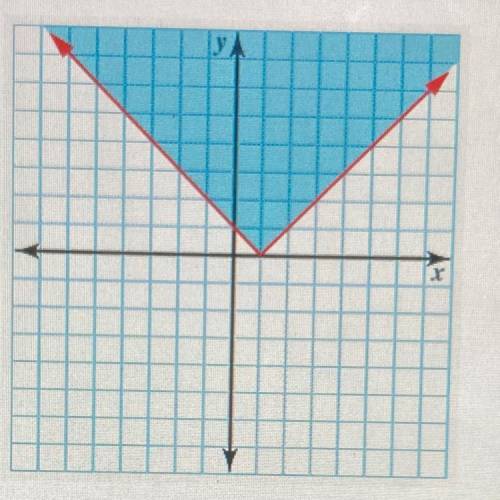
The graph shown is the solution set for which of the following inequalities?
O y> x + 1
O...

Mathematics, 03.06.2021 01:00 xwalker6772
The graph shown is the solution set for which of the following inequalities?
O y> x + 1
O y>ixi + 1
O y > Ix - 11


Answers: 3


Another question on Mathematics

Mathematics, 20.06.2019 18:04
The expression 42 plus 57 shows how much money nate spent at a store .which expression also shows how much money nate spend
Answers: 1

Mathematics, 21.06.2019 15:00
This week, conrad will work 1 3/4 times longer than last week. giovanni will work 1 1/3 times longer than last week. sally will work 2/3 the number of hours she worked last week. match each employee's name to the number of hours he or she will work this week
Answers: 1

Mathematics, 21.06.2019 17:00
In triangle opq right angled at p op=7cm,oq-pq=1 determine the values of sinq and cosq
Answers: 1

Mathematics, 21.06.2019 23:30
Graph the line with the given slope m and y-intercept b. m=-3,b=1
Answers: 1
You know the right answer?
Questions


Mathematics, 26.03.2021 05:30

Mathematics, 26.03.2021 05:30

Advanced Placement (AP), 26.03.2021 05:30


Biology, 26.03.2021 05:30

History, 26.03.2021 05:30

Mathematics, 26.03.2021 05:30


Mathematics, 26.03.2021 05:30

English, 26.03.2021 05:30


Mathematics, 26.03.2021 05:30


Mathematics, 26.03.2021 05:30


Mathematics, 26.03.2021 05:30

Mathematics, 26.03.2021 05:30


