
Mathematics, 03.06.2021 04:00 issaaamiaaa15
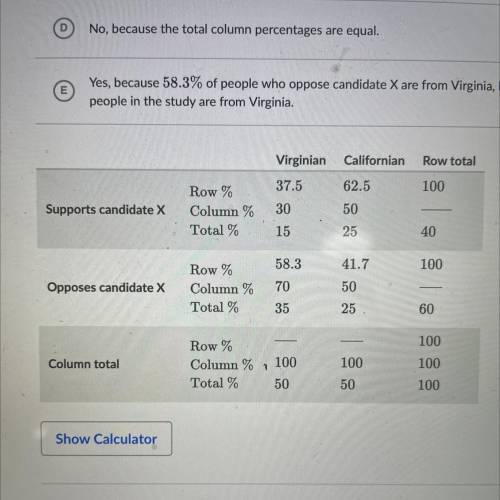
The relative frequency table below summarizes a survey about support for candidate X in an upcoming
national election. In this survey, 210 randomly selected Virginians opposed candidate x
How many people in this surgery were Californians who opposed candidate X
Does the table show evidence of an association between being from Virginia and opposing Candidate X choose all answer that applies
A) Yes because 70% of Virginians oppose candidate X for only 58.3% of people who oppose Canada X are Virginians
B) yes because 70% of Virginia oppose candidate X but only 60% of all people oppose him
C) yes because Virginia who who oppose Candidate X have the smallest joint relative frequency
D) no because the total, column percentages are equal
E) yes because 58.3% of people who oppose Candidate X are from Virginia but only 50% of all people in the study are from Virginia

Answers: 1


Another question on Mathematics
Mathematics, 21.06.2019 22:10
Using graph paper, determine the line described by the given point and slope. click to show the correct graph below.(0, 0) and 2/3
Answers: 2
Mathematics, 21.06.2019 23:00
The distance between two points is 6.5cm and scale of map is 1: 1000 what's the distance between the two points
Answers: 1
You know the right answer?
The relative frequency table below summarizes a survey about support for candidate X in an upcoming...
Questions

Mathematics, 13.05.2021 23:20
Chemistry, 13.05.2021 23:20


Mathematics, 13.05.2021 23:20
Mathematics, 13.05.2021 23:20
Mathematics, 13.05.2021 23:20


