
Mathematics, 03.06.2021 14:00 flyingcerberus1408
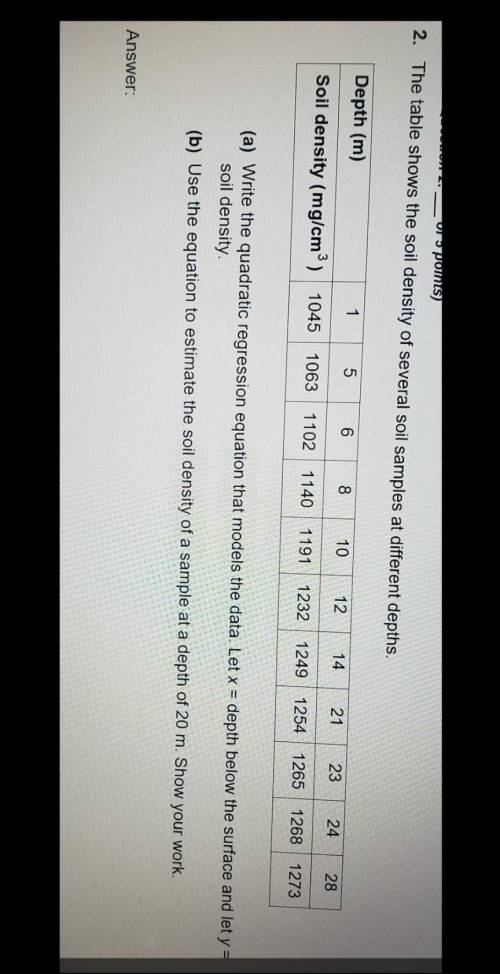
The table shows the soil density of several soil samples at different depths. A) Write the quadratic regression equation that models the data. Let x = depth below the surface and let y = soil density. (B) Use the equation to estimate the soil density of a sample at a depth of 20 m. Show your work. ( Look at the picture for the table and Answer Part A and Answer Part B) Will Mark Brainliest if correct.

Answers: 3


Another question on Mathematics
Mathematics, 21.06.2019 15:00
What kinds of numbers make up the set of numbers called the real numbers? give examples when you explain a number type. there are a limited set of types of numbers, but an unlimited number of examples of these numbers.
Answers: 3
Mathematics, 21.06.2019 15:30
Will used 20 colored tiles to make a design in art class. 5/20 of his tiles were red. what is an equivalent fraction for the red tiles?
Answers: 1
Mathematics, 21.06.2019 17:30
Asphere has a diameter of 10 in. what is the volume of the sphere?
Answers: 1
You know the right answer?
The table shows the soil density of several soil samples at different depths. A) Write the quadratic...
Questions

History, 12.11.2019 16:31

English, 12.11.2019 16:31


Computers and Technology, 12.11.2019 16:31

Chemistry, 12.11.2019 16:31
English, 12.11.2019 16:31
Mathematics, 12.11.2019 16:31
Chemistry, 12.11.2019 16:31
History, 12.11.2019 16:31
Biology, 12.11.2019 16:31
Mathematics, 12.11.2019 16:31
History, 12.11.2019 16:31

Biology, 12.11.2019 16:31


