Mathematics, 04.06.2021 05:10 irene1806
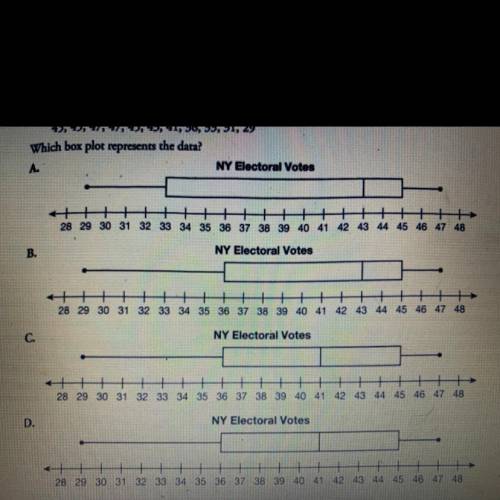
The data shows the number of electoral votes that New York has had for president in each decade since 1912.
45, 45, 47, 47, 45, 43, 41, 36, 33, 31, 29
Which box plot represents the data?


Answers: 1


Another question on Mathematics

Mathematics, 21.06.2019 16:00
Determine the volume of a cylinder bucket if the diameter is 8.5 in. and the height is 11.5 in.
Answers: 1


Mathematics, 22.06.2019 01:30
Novak gives 9 packs of paper to a group of 5 students. if the group shares the paper equally how many packs of paper does each student get. write the a answer as a mixed number
Answers: 1

Mathematics, 22.06.2019 02:30
Mr. jones determined that the equation y = 98 - 16/5 x could be used to predict his students' unit test scores, based on the number of days, x, a student was absent during the unit. what was the meaning of the y-intercept of the function? (by the way the 16/5 is a )
Answers: 3
You know the right answer?
The data shows the number of electoral votes that New York has had for president in each decade sinc...
Questions

Social Studies, 06.05.2020 23:07

Mathematics, 06.05.2020 23:07


Spanish, 06.05.2020 23:07


Mathematics, 06.05.2020 23:07


History, 06.05.2020 23:07


Mathematics, 06.05.2020 23:07


English, 06.05.2020 23:07


History, 06.05.2020 23:07

Advanced Placement (AP), 06.05.2020 23:07

Mathematics, 06.05.2020 23:07


Mathematics, 06.05.2020 23:07


