
Mathematics, 04.06.2021 05:30 camrynhelm8278
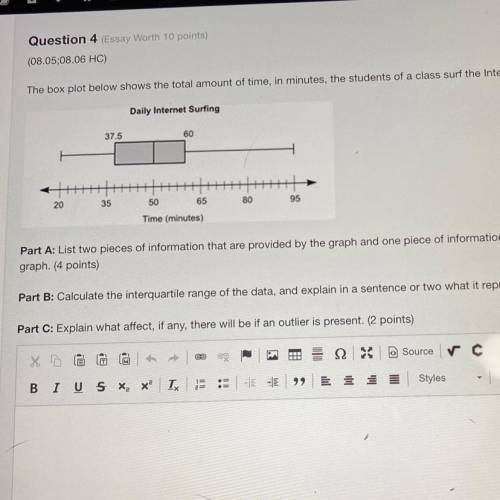
The box plot below shows the total amount of time, in minutes, the students of a class surf the Internet every day
Daily Internet Surfing
37.5
60
35
50
65
80
Time (minutes)
Part A: List two pieces of information that are provided by the graph and one piece of information that is not provided by the
graph. (4 points)
Part B: Calculate the interquartile range of the data, and explain in a sentence or two what it represents. (4 points)
Part C: Explain what affect, if any, there will be if an outlier is present. (2 points)

Answers: 2


Another question on Mathematics
Mathematics, 21.06.2019 19:40
Neoli is a nurse who works each day from 8: 00 am to 4: 00 pm at the blood collection centre. she takes 45 minutes for her lunch break. on average, it takes neoli 15 minutes to collect each sample and record the patient's details. on average, how many patients can neoli see each day?
Answers: 3
Mathematics, 21.06.2019 19:50
If your teacher tells you to do questions 6 through 19 in your math book for homework, how many questions is that
Answers: 1
Mathematics, 21.06.2019 22:00
Apackage of five erasers cost 0. $.39 at this rate how many how much would 60 erasers cost in dollars and cents
Answers: 2
Mathematics, 22.06.2019 01:10
Of jk j(–25, 10) k(5, –20). is y- of l, jk a 7: 3 ? a. –16 b.–11 c. –4 d.–1
Answers: 1
You know the right answer?
The box plot below shows the total amount of time, in minutes, the students of a class surf the Inte...
Questions
Mathematics, 18.08.2019 08:30
Mathematics, 18.08.2019 08:30
Mathematics, 18.08.2019 08:30
Mathematics, 18.08.2019 08:30

Biology, 18.08.2019 08:30
Biology, 18.08.2019 08:30

Business, 18.08.2019 08:30

Geography, 18.08.2019 08:30

History, 18.08.2019 08:30
Biology, 18.08.2019 08:30

Mathematics, 18.08.2019 08:30
Biology, 18.08.2019 08:30

Mathematics, 18.08.2019 08:30


