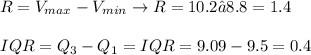
The box plots represent the distances run by the players in a football match.
Team B
8.7 88 8...

Mathematics, 04.06.2021 18:50 fantasticratz2
The box plots represent the distances run by the players in a football match.
Team B
8.7 88 89 90 91 92 93 9.4 0.5 0.6 0.7 08 09 10.0 10.1 10.2 10.3 10.4
Distance run (km)
The players in Team A ran more consistent distances.
How do the box plots show this?
(Total 1 mark)

Answers: 2


Another question on Mathematics
Mathematics, 21.06.2019 16:30
Why do interests rates on loans to be lower in a weak economy than in a strong one
Answers: 3
Mathematics, 21.06.2019 17:00
The equation of a circle is (x + 4)2 + (y + 6)2 = 16. determine the length of the radius. 10 4 16 8 my flower basket delivers flowers within a 20 mile radius of their store. if this area is represented graphically, with my flower basket located at (5, 2), what is the equation that represents the delivery area? (x - 2)2 + (y - 5)2 = 20 (x - 5)2 + (y - 2)2 = 20 (x + 5)2 + (y + 2)2 = 400 (x - 5)2 + (y - 2)2 = 400
Answers: 1
Mathematics, 21.06.2019 20:00
Afrequency table of grades has five classes (a, b, c, d, f) with frequencies of 3, 13, 14, 5, and 3 respectively. using percentages, what are the relative frequencies of the five classes?
Answers: 3
You know the right answer?
Questions

Social Studies, 19.11.2020 02:30


History, 19.11.2020 02:30
Mathematics, 19.11.2020 02:30
Mathematics, 19.11.2020 02:30
Biology, 19.11.2020 02:30
History, 19.11.2020 02:30
Mathematics, 19.11.2020 02:30
Mathematics, 19.11.2020 02:30
Mathematics, 19.11.2020 02:30

Mathematics, 19.11.2020 02:30
Mathematics, 19.11.2020 02:30


